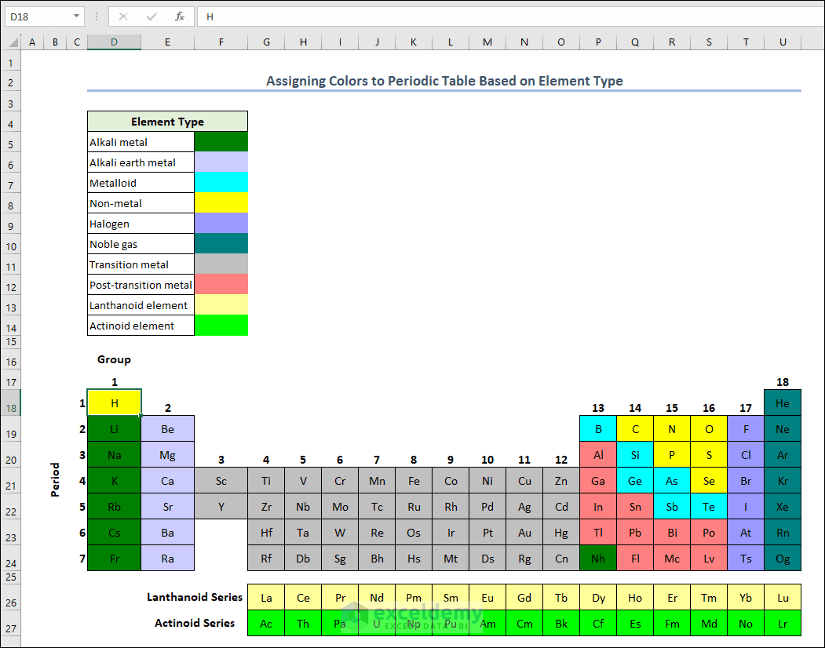
Build a Custom Color Coded Periodic Table Like a Pro
Standard periodic tables are undeniably useful, but they are often visually overwhelming and rarely tailored to specific projects. Whether you are a chemistry educator looking to highlight electron configurations, a student trying to memorize reactivity trends, or a designer crafting a data visualization, knowing how to build your own custom color coded periodic table of elements like a pro is an invaluable skill.

Creating a bespoke table allows you to control the narrative, emphasize specific elemental properties, and match your exact design aesthetic. In this guide, we will walk through the entire process, from defining your data set and selecting software to implementing a professional color theory framework.
Define the Purpose and Data Set
Before touching any design software, you need to establish what your periodic table is trying to communicate. A custom table is only as good as the underlying data.
Determine Your Focus
Ask yourself what story your table needs to tell. Are you focusing on atomic radius, electronegativity, melting points, or historical discovery dates? Limiting your focus prevents visual clutter and ensures your color coding has a clear logical hierarchy.
Gather and Verify Your Data
Compile your elements using reliable scientific sources such as the International Union of Pure and Applied Chemistry (IUPAC) or the National Institute of Standards and Technology (NIST). Create a spreadsheet containing the 118 elements with the following columns:
- Atomic Number
- Element Symbol
- Element Name
- Standard Atomic Weight
- Your Custom Metric (e.g., density, state of matter, or toxicity level)
Choose Your Tools
The tool you choose depends on your technical skill level and whether you want a static poster or an interactive digital dashboard.
For Static, High-Resolution Posters
If you want a printable graphic for a classroom wall or a portfolio piece, vector design software is your best option.
- Adobe Illustrator: The gold standard for professional layout and precise color management.
- Inkscape: A powerful, free open-source alternative to Illustrator that handles SVG exports effortlessly.
For Data-Driven and Interactive Tables
If you want a table that updates dynamically based on user input or filters:

- Tableau or PowerBI: Excellent for drag-and-drop color-coded data grids.
- Python (Plotly/Matplotlib) or JavaScript (D3.js): Ideal for developers who want complete control over interactive tooltips and custom color scales.
Master Color Theory for Chemistry
The hallmark of a professional periodic table is a thoughtful color palette. Randomly assigning bright colors creates visual chaos. Instead, use intentional color schemes based on your data type.
Sequential Palettes for Numeric Data
If your custom table ranks elements by a continuous numeric scale—like boiling point or electronegativity—use a sequential color palette. This means transitioning from a light shade to a dark shade of a single hue (e.g., pale blue to deep navy) to naturally signal low-to-high values.
Categorical Palettes for Discrete Groups
If your table categorizes elements by discrete states (such as metal, metalloid, nonmetal, or synthetic), choose a categorical palette. Ensure the colors have distinct hues, but maintain similar saturation levels so no single group visually overpowers the others.
Accessibility and Contrast
Always design with colorblindness in mind. Roughly 8% of men and 0.5% of women have some form of color vision deficiency. Avoid red-green color combinations unless paired with distinct texture patterns or clear text labels. Use online tools like ColorBrewer or Coblis to test your final palette.
Step-by-Step Layout and Design
With your data and color palette ready, it is time to construct the grid.
- Set up the Grid: Establish the classic 18-column by 7-row grid, leaving appropriate spacing for the Lanthanide and Actinide series at the bottom.
- Design the Element Tile: Create a standard template for a single element box. Include the atomic number in the top left, the chemical symbol prominently in the center, the name below it, and your numerical metric at the bottom.
- Apply the Colors: Link each element cell to its corresponding color value from your spreadsheet or design swatch panel.
- Establish Typography: Stick to clean, highly legible sans-serif fonts like Helvetica, Roboto, or Inter. Ensure high contrast between the text color and the element tile background.
Final Polish and Export
Review your custom periodic table for common errors. Double-check atomic numbers, verify that symbol spellings are correct, and ensure the legend clearly explains what your color coding represents. If you are printing your design, export the file in CMYK color mode at 300 DPI in a vector format like PDF or SVG. For digital use, export as a high-resolution PNG or embed your interactive code directly into a web portfolio.
By combining rigorous data organization with professional graphic design principles, you can create a stunning, highly informative periodic table that stands far above standard textbook graphics.