CenterPoint Outage Tracker: Is the Grid Failing?
Whenever a severe thunderstorm, tropical system, or cold front sweeps across Greater Houston, viral posts inevitably emerge claiming that the latest spike on the Outage Tracker CenterPoint: Proof That Power Grid Is About to Fail? See This! is undeniable evidence of an imminent systemic collapse. Dramatic screenshots showing hundreds of thousands of customers in the dark regularly ignite panic across social media platforms.

While power outages are undeniably frustrating, disruptive, and at times dangerous, reading an outage map requires context. Does a red cluster on the CenterPoint Energy dashboard really prove that the bulk electrical grid is teetering on the edge of destruction? The short answer is no. To understand why, you must understand the difference between local power delivery and bulk power generation.
Outage Tracker CenterPoint: Proof That Power Grid Is About to Fail?
To evaluate whether CenterPoint’s outage map signals a broader grid disaster, it helps to understand how the Texas electrical system is structured. In simple terms, the power sector is divided into two distinct components: wholesale generation and retail distribution.
CenterPoint Energy is a Transmission and Distribution Utility (TDU). They do not generate electricity. Instead, they own and maintain the physical infrastructure—substations, utility poles, transformers, and neighborhood power lines—that delivers electricity across a 5,000-square-mile territory covering Houston and surrounding counties.
Meanwhile, the bulk grid’s balance between total power generation and statewide demand is managed by the Electric Reliability Council of Texas (ERCOT). When headlines proclaim that the “grid is about to fail,” they are usually referring to a catastrophic generation shortage where supply cannot meet demand, forcing ERCOT to order rolling blackouts (as occurred during Winter Storm Uri in 2021).
When you see 400,000 or even 2 million customers without power on CenterPoint’s tracker, it is almost never because the power plants stopped running. It is because physical assets on the ground took severe localized damage.
Distribution Failures vs. Grid Collapse
The distinction between distribution damage and grid failure comes down to where the system breaks:
- Bulk Grid Failure (Generation Shortfall): Power plants trip offline, or demand spikes far beyond available megawatts. ERCOT intervenes to deliberately shut down circuits across the state to prevent equipment from melting or destroying itself.
- Distribution Outage (Physical Damage): Power plants are running normally, but high winds, fallen oak branches, or lightning strikes snap utility poles and sever wires. The power exists on the high-voltage lines, but it cannot physically reach your breaker box.
Therefore, a catastrophic spike on the CenterPoint tracker is proof of extreme weather impacts on local infrastructure, not proof that the statewide Texas power grid is about to suffer total collapse.
Why CenterPoint’s Tracker Became So Controversial
Public distrust in CenterPoint’s digital tracking tools did not happen in a vacuum. During the May 2024 Houston derecho and Hurricane Beryl in July 2024, millions of residents were plunged into prolonged blackouts in sweltering summer heat. At the height of the crisis, CenterPoint’s legacy outage map crashed repeatedly, leaving residents with virtually zero visibility into when power would return.
The situation became so absurd that local residents famously turned to the Whataburger mobile app to monitor store openings as a makeshift indicator of which neighborhoods had electricity. The failure of the official tracker created an information vacuum, which was quickly filled by viral rumors, sensational conspiracy theories, and legitimate public outrage.
In response to regulatory scrutiny from the Public Utility Commission of Texas (PUCT) and state lawmakers, CenterPoint overhauled its digital systems, introducing a redesigned cloud-hosted outage tracker designed to handle extreme traffic surges and provide clearer restoration milestones.
How to Read the CenterPoint Outage Tracker Accurately

To avoid falling for misleading headlines during the next major weather event, here is how to interpret the data displayed on CenterPoint’s tracking platform:
1. Total Customers Affected vs. Total Customers Served
CenterPoint serves more than 2.8 million metered customers. A storm knocking out power to 50,000 customers represents roughly 1.8% of their customer base. While significant for those affected, it is a manageable localized disruption, not a regional breakdown.
2. Incident Clusters vs. Individual Outages
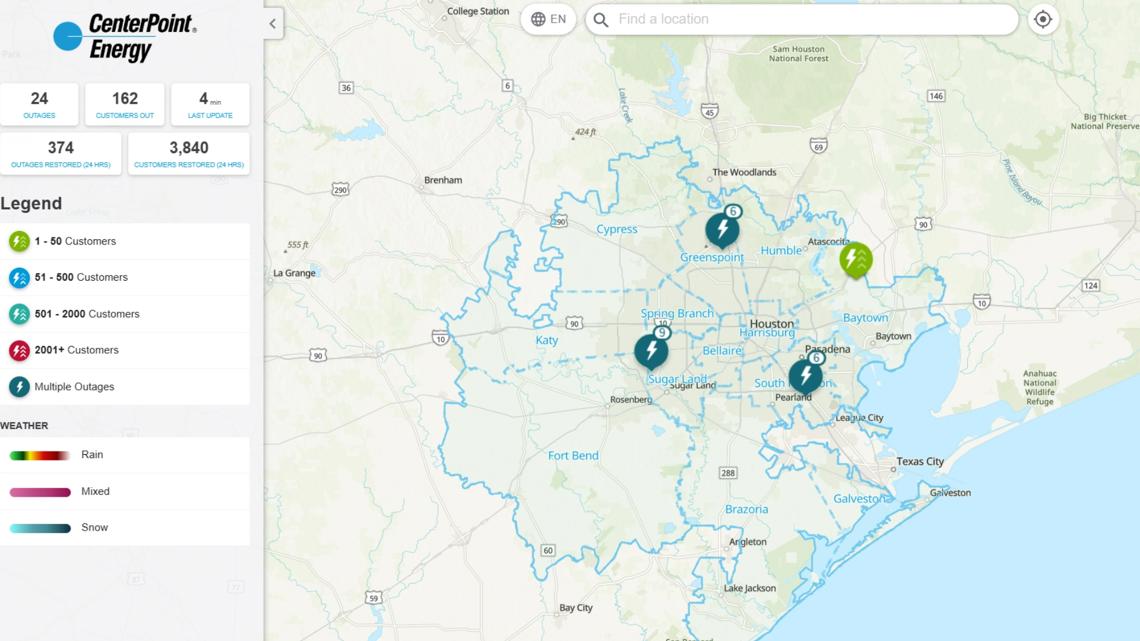
Modern outage maps group outages into clusters by ZIP code or circuit. A single icon showing 3,500 customers out often means one feeder line or mainline fuse tripped at a substation. It does not indicate that the entire neighborhood’s infrastructure is destroyed.
3. Estimated Restoration Times (ETRs)
During the initial phase of a disaster, ETRs are often listed as “Pending Assessment.” Crews must first complete a damage survey (patrolling lines with trucks, drones, and helicopters) before accurate repair windows can be assigned. The absence of an immediate repair date is standard protocol, not evidence that the grid is permanently broken.
4. Color-Coded Assessment Status
CenterPoint’s updated dashboard uses color coding to distinguish between areas currently being assessed, areas assigned to active repair crews, and circuits that have been energized. Paying attention to these phases gives you a realistic timeline of restoration progress.
Real Vulnerabilities That Need Addressing
Debunking the myth that the tracker proves an imminent grid collapse does not mean the local power infrastructure is flawless. Houston’s electric distribution network faces chronic, well-documented challenges:
- Dense Vegetation: Falling trees and limbs contacting overhead lines remain the single largest cause of distribution outages during tropical storms and freezes.
- Aging Wood Poles: Upgrading older class-distribution poles to composite or steel poles is an ongoing, capital-intensive process that will take years to finish.
- Undergrounding Costs: While burying lines prevents wind damage, it is prohibitively expensive (often exceeding $1 million to $3 million per mile) and leaves lines vulnerable to flooding and prolonged repair times during storm surges.
- Climate Extremes: The Texas Gulf Coast is subject to intensifying weather patterns, requiring utilities to harden infrastructure far beyond historical standards.
What to Do When the Tracker Shows Spreading Outages
When you see outages climbing on the tracker and bad weather is imminent, focus on actionable preparation rather than sensationalized online speculation:
- Sign Up for Direct Alerts: Enroll in CenterPoint’s Power Alert Service (PAS). This system sends automated text or email updates tied directly to your meter number, bypassing the need to constantly refresh a busy web map.
- Check ERCOT Directly: If you want to know whether the statewide bulk grid is actually at risk, check the ERCOT Grid Conditions dashboard. ERCOT displays real-time reserves, current demand, and emergency alert statuses (such as Energy Emergency Alerts 1, 2, or 3).
- Report Specific Hazards: Do not assume the utility knows your line is down. Report downed lines or arcing equipment directly through official emergency channels, and stay at least 35 feet away from any grounded line.
- Maintain Home Resilience: Keep battery banks charged, preserve shelf-stable food and clean water, and ensure backup generators are operated outdoors at least 20 feet away from windows and doors to prevent carbon monoxide poisoning.
A surge of outages on CenterPoint’s tracker is a clear sign that physical lines are taking a beating from Mother Nature, but it is not proof of an impending systemic power grid collapse. By understanding what the map actually shows, residents can separate genuine emergencies from online panic.