City of Oakland Crime Map: How to Track Local Safety
Whether you are moving to a new neighborhood, evaluating commercial real estate, or simply looking to stay informed about your current block, checking a city of oakland crime map is one of the most effective ways to understand local public safety conditions. Oakland, like many major metropolitan hubs, experiences distinct public safety dynamics that vary dramatically from one neighborhood to the next.

However, raw crime statistics can often feel detached from everyday life. Interactive crime maps bridge that gap by translating official police blotters and call logs into visual, geospatial data. This guide breaks down how to access official Oakland crime tracking tools, how to interpret the data accurately, and how to use this information to make informed safety decisions.
Official Tools for the City of Oakland Crime Map
The City of Oakland and the Oakland Police Department (OPD) provide public access to incident records through several verified portals. Instead of relying on neighborhood rumor mills or sensationalized social media posts, these platforms draw directly from OPD’s Computer Aided Dispatch (CAD) and Record Management Systems (RMS).
1. CrimeMapping.com (Official OPD Partner)
Oakland contracts with CrimeMapping.com to provide the public with an up-to-date, address-searchable map of recent criminal incidents. This tool updates automatically as reports are processed by the police department.
- Filtering capabilities: You can filter by date ranges (up to 180 days), specific crime types (assault, burglary, robbery, vehicle break-ins), and distance from a specific street address.
- Automated alerts: Users can define a perimeter around their home, workplace, or school and receive email notifications whenever a verified incident occurs within that zone.
2. City of Oakland Open Data Portal
For data analysts, community organizers, and researchers, the official City of Oakland Open Data Portal (data.oaklandca.gov) hosts raw datasets of crime reports dating back several years. While less intuitive for checking daily activity than an interactive map, it allows you to download historical incident logs, analyze long-term trends, and cross-reference incidents with Oakland City Council districts.
3. LexisNexis Community Crime Map
Another popular tool frequently used alongside city data is the LexisNexis Community Crime Map. It aggregates reports from multiple adjacent law enforcement agencies across Alameda County, including the Alameda County Sheriff’s Office, Emeryville Police, and Berkeley Police. This regional perspective is valuable if you live near city borders where jurisdictional boundaries overlap.
How to Read and Filter Oakland Crime Data
Using an interactive crime map effectively requires more than glancing at clusters of colored pins. Without context, high-density commercial hubs will almost always look more dangerous than quiet residential hills, simply due to foot traffic and commercial activity.
Differentiating Between Part 1 and Part 2 Crimes
The FBI separates criminal activity into two major categories, and Oakland’s mapping tools follow a similar standard:
- Part 1 Crimes (Serious Offenses): These are divided into violent crimes (homicide, rape, aggravated assault, robbery) and serious property crimes (burglary, larceny-theft, motor vehicle theft, arson). Spikes in Part 1 violent crime generally signal genuine safety concerns for pedestrians and residents.
- Part 2 Crimes (Lesser Infractions): These include vandalism, disorderly conduct, drug offenses, and simple assaults. While quality-of-life concerns matter, areas showing dozens of Part 2 icons may simply indicate high foot traffic, active commercial nightlife, or proactive police enforcement rather than imminent physical danger.
Understanding the Data Lag
Most interactive maps do not display incidents in true real time. While dispatch calls occur instantly, an incident typically does not populate on a public crime map until an officer files a formal report and a records supervisor reviews and classifies the offense. This process generally introduces a lag time of 24 to 72 hours. Sensitive incidents, such as domestic violence or crimes involving minors, are often scrubbed or generalized by block to protect victim privacy.

Oakland Neighborhood Context and Geography
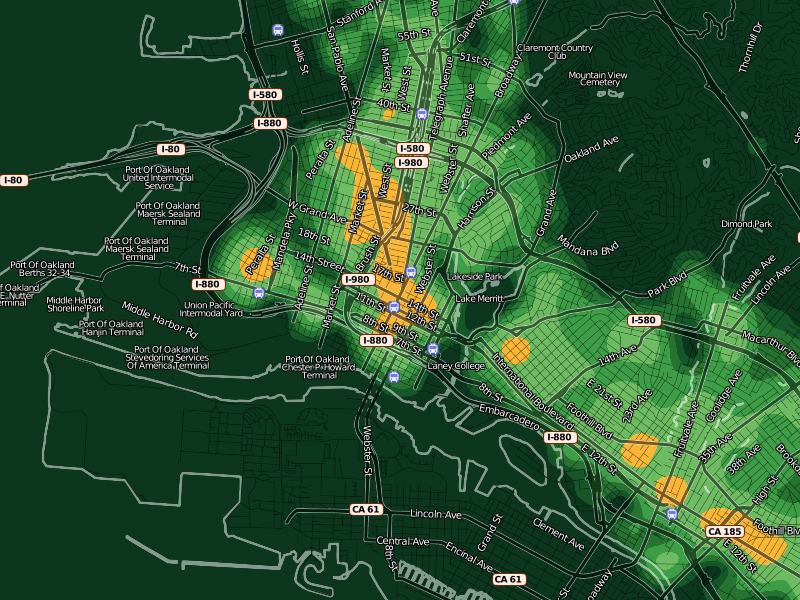
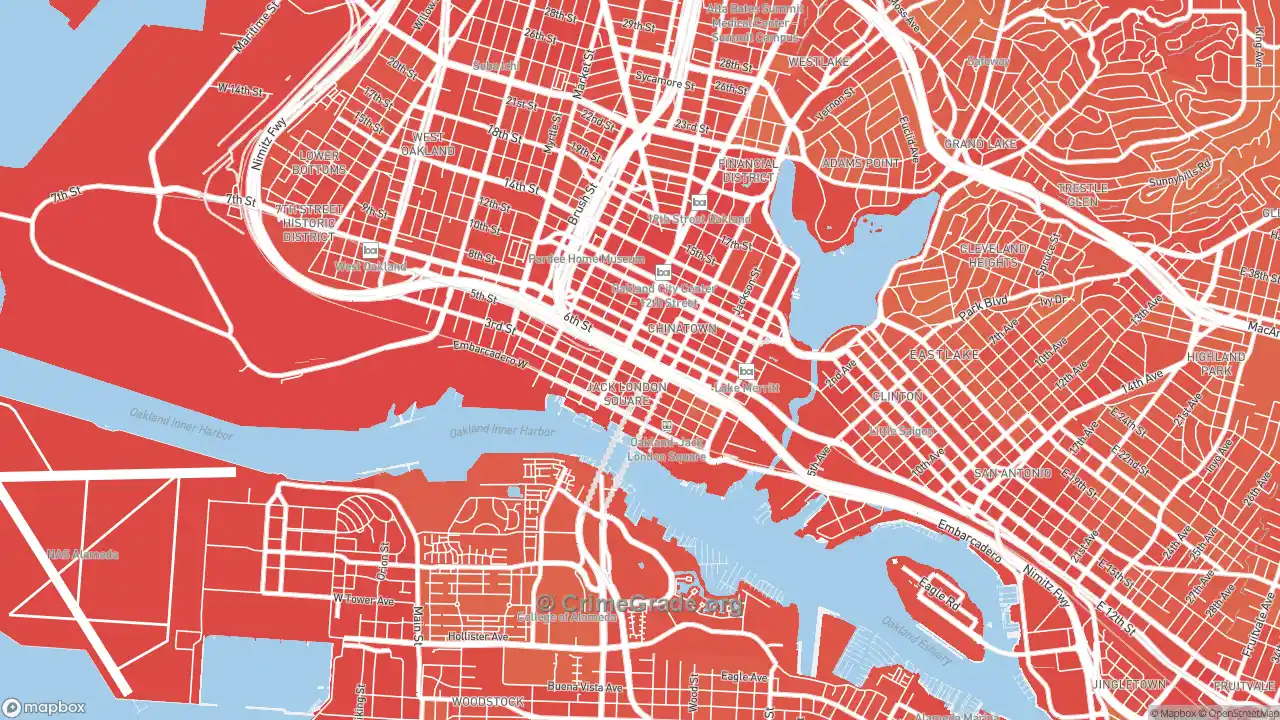
Oakland covers nearly 56 square miles of land and is divided administratively into seven City Council districts and more than 35 Police Beats. Crime patterns across these zones reflect distinct urban realities.
Downtown, Uptown, and Jack London Square (Beats 01X–05X)
These commercial and entertainment corridors have the highest density of vehicle break-ins (colloquially called "bipping") and petty theft. Because thousands of visitors, diners, and workers converge here daily, property crime numbers can appear disproportionately elevated compared to the resident population. Violent crimes in these zones occur primarily late at night near crowded venues.
East Oakland (Beats 26X–35X)
Stretching from Fruitvale down to the San Leandro border, flatland neighborhoods in East Oakland historically register higher rates of serious violent crime, gun violence, and commercial robberies. Community safety initiatives, such as the Department of Violence Prevention and local Ceasefire operations, focus heavy resources in these corridors.
North Oakland and West Oakland (Beats 06X–10X)
These diverse, rapidly shifting neighborhoods show a mix of residential burglary, catalytic converter theft, and street robberies near transit hubs like MacArthur and West Oakland BART stations. Foot traffic near major commercial arteries often influences theft rates.
The Oakland Hills and Montclair (Beats 11X–13Z)
Violent crime is statistically rare in the Oakland Hills. Instead, crime maps for these hillside communities almost exclusively highlight residential burglaries, package thefts, and occasional organized auto thefts targeting high-end vehicles.
Actionable Steps Beyond the Map
Consulting a crime map is only the diagnostic phase. To protect yourself, your family, and your property, integrate map findings into practical habits:
- Attend your local NCPC: Oakland operates Neighborhood Crime Prevention Councils (NCPCs) paired with each police beat. These meetings bring together residents and the assigned Beat Health Officer to tackle specific problem properties and localized crime trends.
- Practice strict vehicle hygiene: Property crime maps consistently show high numbers of auto burglaries throughout the city. Never leave bags, charging cables, electronics, or loose change visible inside a parked vehicle, even in secured residential garages.
- Pair maps with neighborhood alerts: Supplement crime mapping platforms with municipal alert systems like AC Alert and Nixle, which transmit urgent warnings about active police scenes, road closures, and localized emergencies directly to your mobile device.
Limitations of Relying Solely on Crime Maps
While an interactive map provides empirical data, it does not tell the complete story of a community. Property crimes—particularly retail shoplifting, stolen bicycles, and minor car break-ins—often go unreported by victims fatigued by paperwork or insurance deductibles. Consequently, some busy areas may have even higher property crime rates than mapped data suggests.
Conversely, raw incident markers do not measure neighborhood resilience, active merchant associations, community cohesion, or recent municipal interventions. Use the city of Oakland crime map as an objective baseline, but combine its insights with in-person visits at different times of day to develop a balanced, realistic understanding of any Oakland neighborhood.