Cleveland Weather Underground: Local Forecast Guide
Cleveland is legendary for its volatile weather. From sudden summer squalls rolling across Lake Erie to blinding winter lake-effect snow squalls that bury the East Side while leaving the West Side bone dry, a single regional forecast rarely tells the whole story. For residents, commuters, and boaters navigating these dramatic shifts, turning to cleveland weather underground offers a level of precision that traditional airport-based reports simply cannot match.
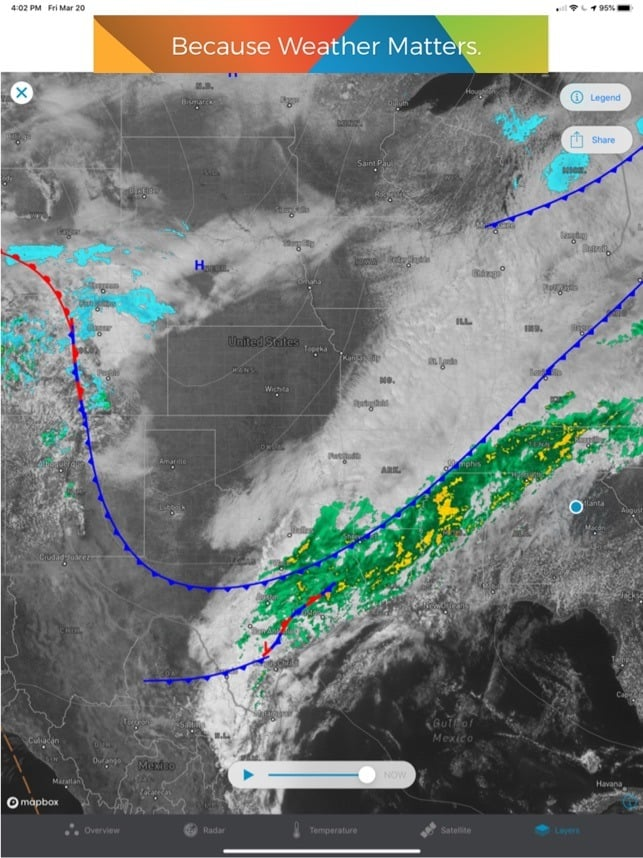
By relying on a dense, decentralized network of Personal Weather Stations (PWS) paired with high-resolution radar, Weather Underground provides hyper-local, block-by-block meteorological data. Here is an in-depth look at how Cleveland’s microclimates work, how to leverage Weather Underground’s tools, and how to get the most accurate local forecasts year-round.
The Science Behind Cleveland's Unpredictable Climate
To understand why hyper-local data matters in Northeast Ohio, you must first understand the geographic engine driving the region: Lake Erie. As the shallowest of the Great Lakes, Erie warms up rapidly in the summer and cools just as quickly in late autumn, acting as a massive heat and moisture pump right on Cleveland’s northern border.
This dynamic creates several distinct local weather phenomena:
- The Lake Breeze Front: During spring and early summer, warm air over the land rises, pulling chilly air inland off Lake Erie. Downtown Cleveland and shoreline communities like Lakewood and Bratenahl can easily sit at 58°F under heavy marine cloud cover, while southern suburbs like Strongsville or Independence bask in 75°F sunshine.
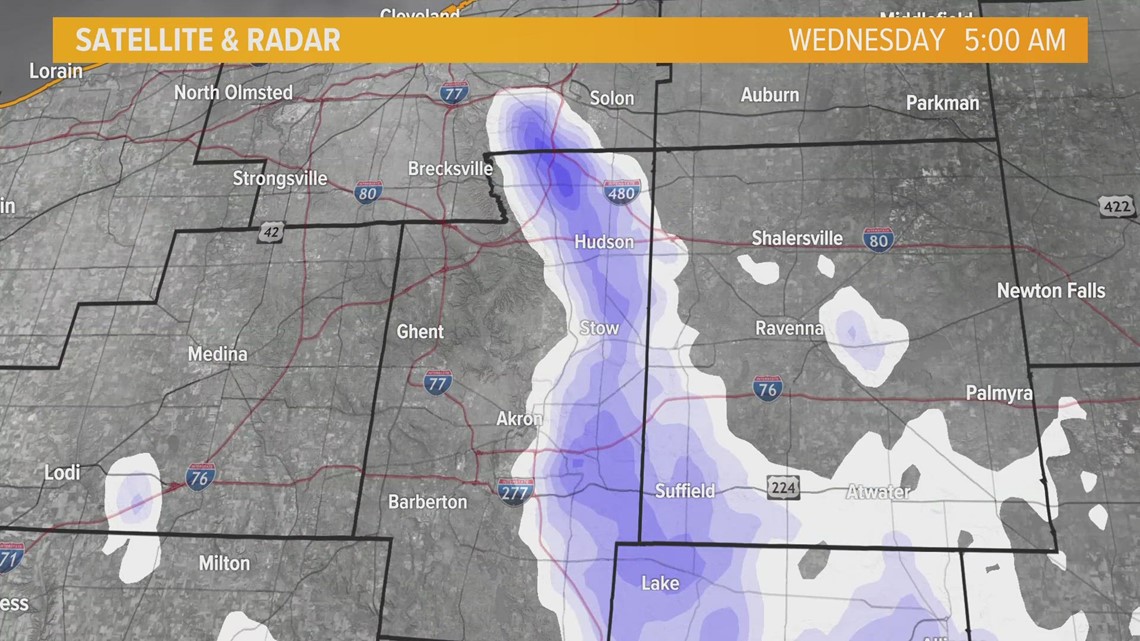
- The Primary Snowbelt: When arctic air sweeps over open, warmer lake water in winter, it picks up vast amounts of moisture. As this air mass hits the rising elevation of the Portage Escarpment on the East Side, the air cools rapidly and dumps snow. Neighborhoods like Cleveland Heights, University Circle, and eastern suburbs can receive 12 inches of snow, while Cleveland Hopkins International Airport (located southwest of downtown) records barely an inch.
- The Urban Heat Island: Downtown Cleveland's concrete, asphalt, and high-rises absorb and radiate heat, keeping overnight low temperatures several degrees higher than outlying semi-rural suburbs in Geauga or Medina counties.
Using Cleveland Weather Underground for Microclimate Tracking
Most commercial weather apps source their data from a single official automated surface observing station, typically located at Cleveland Hopkins International Airport (KCLE) or Burke Lakefront Airport (KBKL). While reliable, these readings reflect conditions on tarmac miles away from where most residents live and work.
Weather Underground flips this model by crowdsourcing data from hundreds of individually calibrated PWS setups installed by meteorologists, schools, and weather enthusiasts across Cuyahoga County and beyond. When using cleveland weather underground resources, you can pinpoint stations situated in specific environments:
- Lakewood & Rocky River (Lakefront West): Monitor real-time marine layer effects, early-morning wind shifts, and moderate winter temperatures buffered by the water.
- Downtown & The Flats: Track sudden wind gusts funneled through city streets and immediate shoreline wave conditions.
- Cleveland Heights & Shaker Heights: Observe elevation-driven temperature drops and the initial transition line where rain flips over to heavy, wet snow.
- Parma & Strongsville (South/Southwest): Gauge continental warmth during summer heatwaves and severe thunderstorm tracks pushing northeast out of rural Ohio.
Key Features to Maximize on WunderMap
The crown jewel of Weather Underground for Northeast Ohioans is the interactive WunderMap. When severe weather threatens, relying on a 7-day text forecast is insufficient. The map view lets you overlay real-time data streams to build a comprehensive picture of active systems.
1. High-Resolution Doppler Radar Overlays
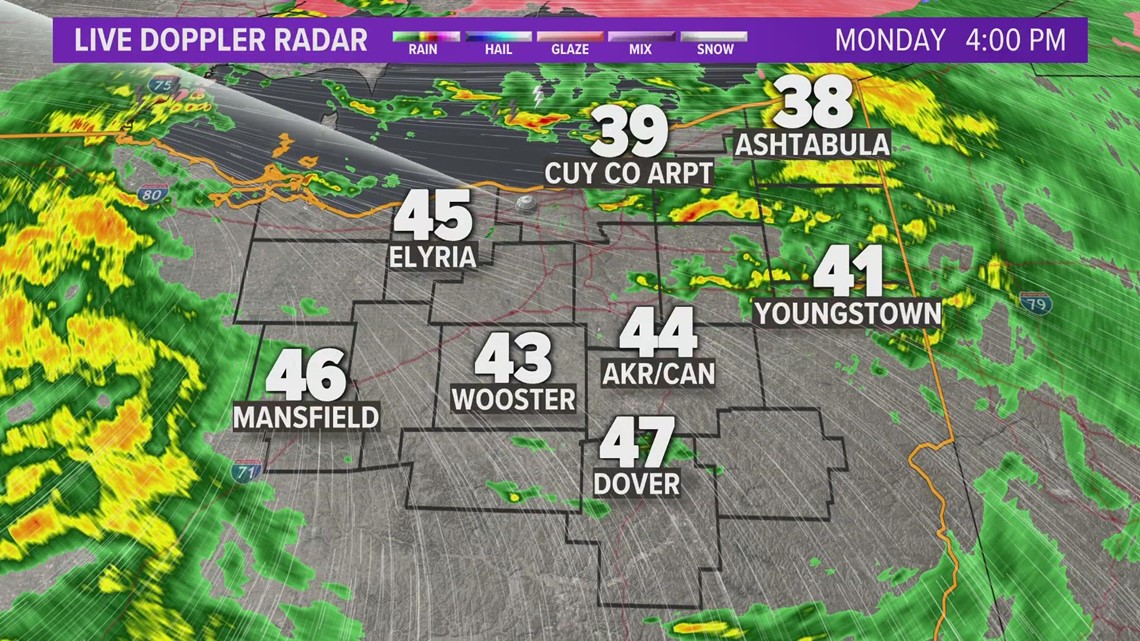
Standard radar updates every 5 to 10 minutes, but storm cells moving at 45 mph across Lake Erie can change rapidly. The platform allows you to loop composite reflectivity alongside velocity data, helping you spot rotation in severe summer storms or locate the dense, stationary core of a winter lake-effect band.
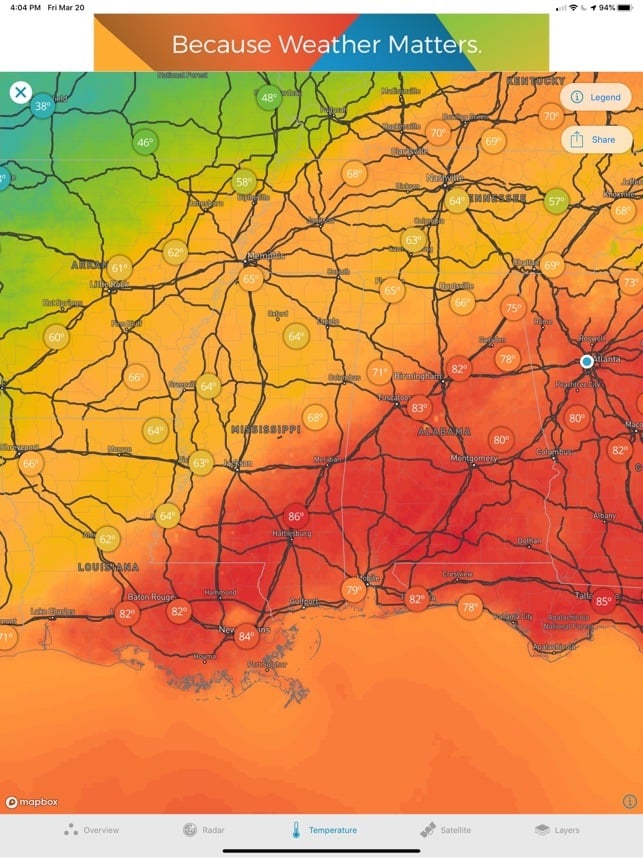
2. Neighborhood Temperature Gradients
By activating PWS temperature pins on the map, you can visibly track the penetration of lake breezes in real time. If you plan an afternoon at Edgewater Park or the Cleveland Museum of Art, a quick scan of lakeside station temperatures tells you whether you need a light jacket despite warm forecasts inland.
3. Wind Speed and Direction Vectors
Wind direction is everything in Cleveland. A wind shifting from south to west-northwest (280°–310°) is the classic setup for lake-effect snow squalls and rapid temperature plunges. The wind vector layer highlights these frontal boundaries before they hit your neighborhood.
How to Pick a Reliable Personal Weather Station
Because anyone with a compatible weather station can upload data to the network, accuracy can occasionally vary depending on station placement. A sensor mounted on a hot asphalt roof will read artificially high in July, while a rain gauge placed beneath an overhanging tree branch will underreport precipitation.
When selecting your default station on the platform, look for the following indicators of quality:
- Hardware Quality: Stations utilizing research-grade hardware (such as Davis Vantage Pro2 or Ambient Weather commercial-grade units) provide significantly better solar radiation shielding and accurate barometric pressure readings.
- Consistent Reporting: Look for stations with a solid history of continuous, uninterrupted data uploads, showing smooth temperature curves rather than erratic, jagged spikes.
- Proximity to Natural Airflow: Opt for stations mounted on open lawns or atop unshaded masts away from heat sinks like air conditioning compressors or brick chimneys.
A Seasonal Strategy for Clevelanders
To get the most utility out of hyper-local weather tools in Cleveland, adjust your focus based on the season:
Winter (December – March)
Focus on dew point and surface wet-bulb temperatures. Lake-effect snow often occurs right near the 32°F mark; a one-degree drop can mean the difference between wet slush and treacherous ice on Interstate 90. Track dew points to see how efficiently falling precipitation will chill the lower atmosphere.
Spring (April – May)
Pay close attention to wind direction flags. When winds blow from the north or northeast off an icy Lake Erie, coastal temperatures routinely stall in the 40s while areas 15 miles south climb into the 70s. Plan outdoor activities around the depth of this marine layer.
Summer (June – August)
Monitor barometric pressure drops and heat index values. High humidity pooling over the lake basin can destabilize rapidly during peak afternoon heating. A sharp drop on neighborhood barometers frequently signals that a pop-up thunderstorm is developing overhead before radar sweeps catch the core aloft.
Fall (September – November)
Watch wind gust data. Autumn brings intense low-pressure systems across the Great Lakes (often dubbed the "Witches of November"). These systems generate gale-force onshore winds that cause shoreline flooding, high waves, and localized tree damage across the northern tier of Cuyahoga County.
Final Thoughts
Cleveland’s complex geography demands a more granular approach to weather tracking than static regional updates can deliver. By leveraging neighborhood personal weather stations, interactive radar, and real-time wind observations, you can anticipate local microclimates, stay safe during severe weather events, and never get caught off guard by the unpredictable shifts off Lake Erie.