Discover Instant Pendulum Lab Answers Today
Physics practicals are a staple of high school and introductory college science courses. Among these, the simple pendulum experiment is one of the most reliable ways to measure acceleration due to gravity ($g$). However, between experimental errors, inconsistent timing, and complex mathematical formulas, getting the right results can feel like an uphill battle. If you are stuck on your calculations, you have come to the right place to discover instant pendulum lab answers today and finish your assignment with confidence.

Understanding the Simple Pendulum Experiment
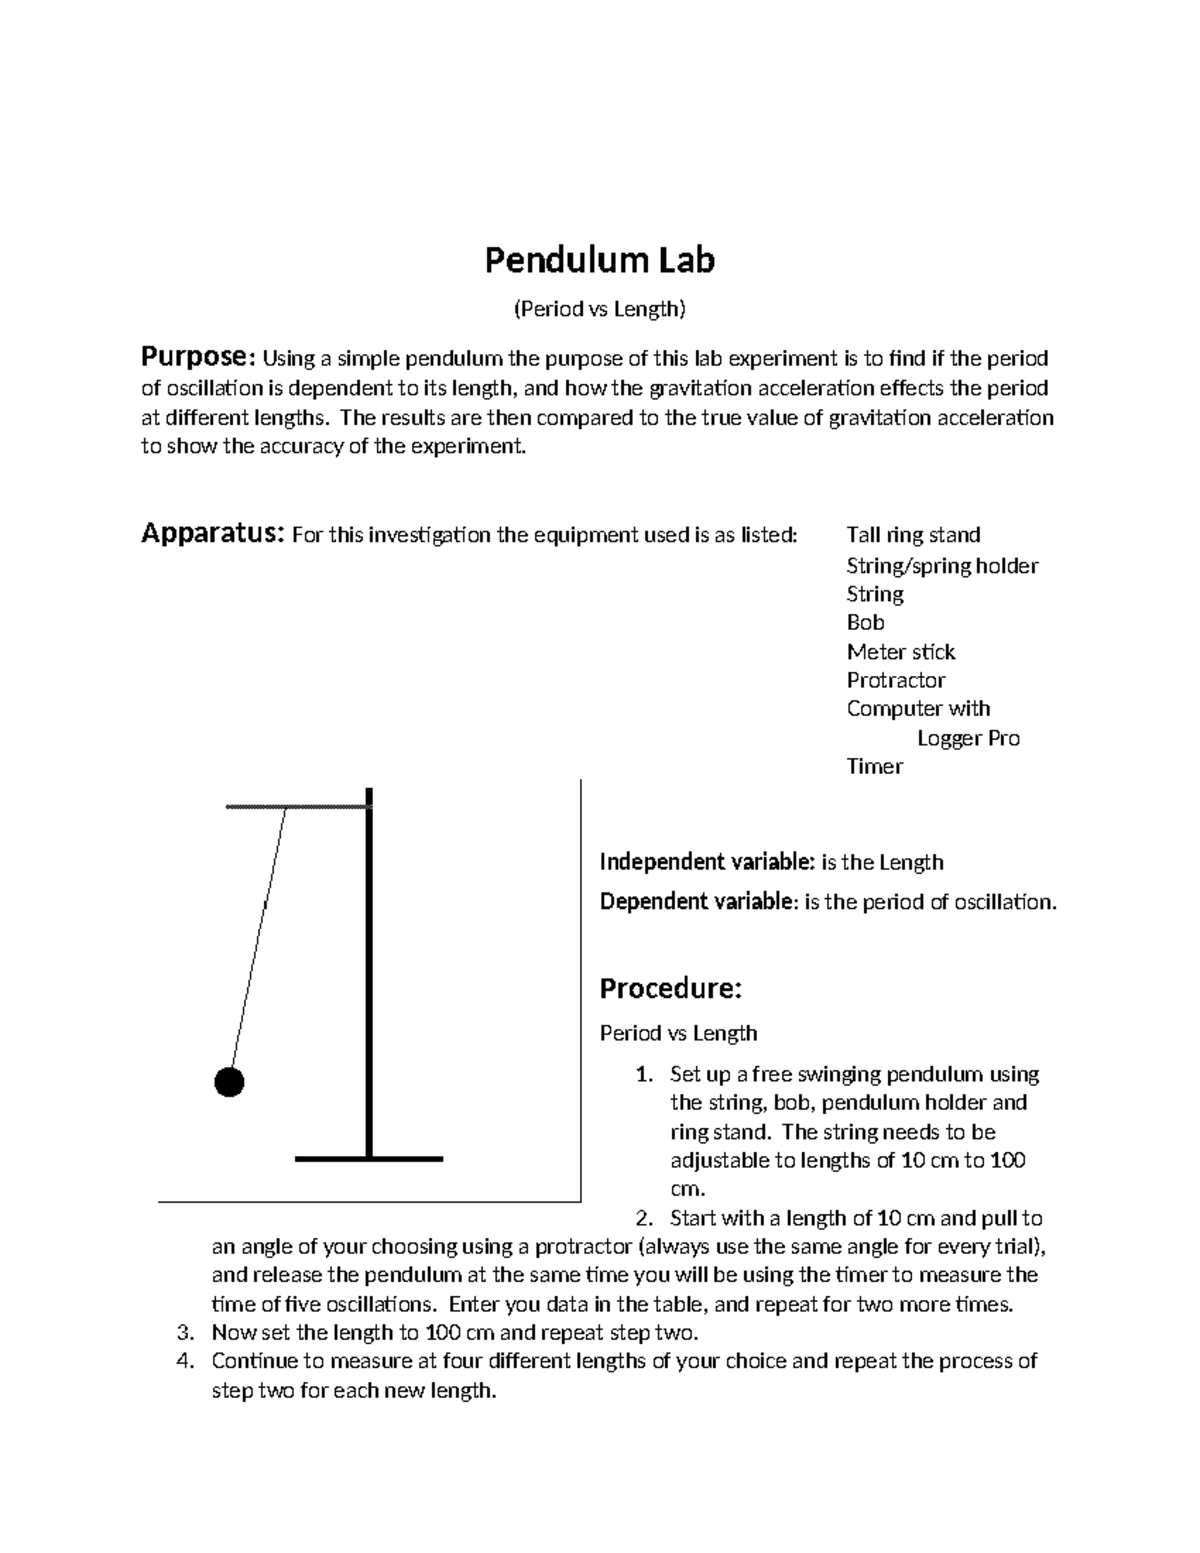
Before diving straight into the numbers, it helps to understand what the experiment is actually trying to prove. A simple pendulum consists of a small mass (known as a bob) hung from a light string or wire fixed at a pivot point. When pulled away from its resting equilibrium position and released, it swings back and forth in a periodic motion.
The primary goal of this lab is usually to determine how the length of the string ($L$) affects the period of the swing ($T$), and subsequently, to calculate the experimental value of gravity ($g$). The standard equation governing this relationship is:
$$T = 2\pi \sqrt{\frac{L}{g}}$$
By rearranging this formula to solve for $g$, we get:
$$g = \frac{4\pi^2 L}{T^2}$$
Step-by-Step Data Analysis and Calculations
Most student struggles in this lab happen during the data processing phase. If your calculated value for gravity is nowhere near the accepted standard of $9.81 \text{ m/s}^2$, your lab report will need a thorough error analysis section. Here is how you should process your data step-by-step:
1. Calculating the Period ($T$)
Video: How To Use Simple Pendulum Lab (step by step)

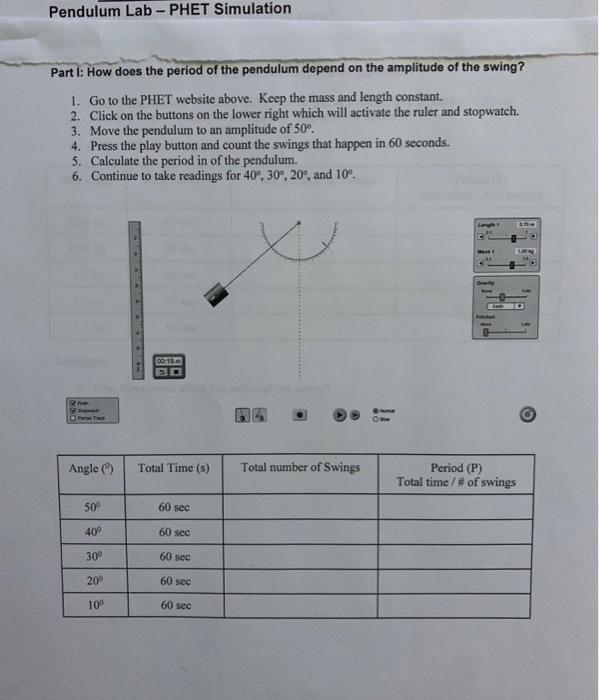
To minimize human reaction-time error, instructors usually ask students to time 10 or 20 full oscillations rather than just one. To find the period of a single oscillation ($T$):
- Record the total time ($t$) it takes for $n$ oscillations.
- Divide the total time by the number of oscillations: $T = \frac{t}{n}$.
- Repeat this process for multiple string lengths (e.g., $0.5\text{m}$, $0.7\text{m}$, $1.0\text{m}$).
2. Squaring the Period ($T^2$)
When you plot a graph of Length ($L$) versus Period ($T$), the resulting line is curved. However, linear graphs are much easier to analyze. By plotting $L$ on the y-axis against $T^2$ on the x-axis, you create a straight line.
- Square each of your calculated period values ($T^2$).
- Plot $L$ vs. $T^2$ on graph paper or using spreadsheet software like Excel.
- Find the slope of the line of best fit. The slope ($m$) represents $\frac{g}{4\pi^2}$.
- Calculate gravity using the slope: $g = 4\pi^2 \times m$.
Common Sources of Experimental Error
When your lab manual asks for a discussion of errors, simply writing "human error" is rarely enough to earn full marks. Teachers want specific, quantifiable reasons why your experimental value deviated from $9.81 \text{ m/s}^2$. Here are the most common culprits to include in your report:
- Amplitude too large: The formula $T = 2\pi\sqrt{L/g}$ relies on the small-angle approximation (usually under 15 degrees). If you pulled the bob back too far, simple harmonic motion breaks down, artificially inflating your period values.
- Measurement inaccuracies: Measuring from the suspension point to the center of the bob is critical. Measuring only the string length without including the radius of the spherical bob introduces a systematic error.
- Air resistance and friction: Energy loss due to air drag and friction at the pivot point causes the pendulum to slow down slightly over time, affecting timing consistency.
- Reaction time delay: Starting and stopping the stopwatch manually introduces a fractional-second delay on every trial.
How to Write a Strong Conclusion
A solid conclusion should tie your results back to your initial hypothesis. State your experimental value for gravity clearly, and compare it to the theoretical value using the percentage error formula:
$$\text{Percentage Error} = \frac{|\text{Experimental Value} - \text{Theoretical Value}|}{\text{Theoretical Value}} \times 100\%$$
If your percentage error is under 5% to 10%, you can conclude that the experiment was successful. If your error is higher, explain which of the factors mentioned above contributed most heavily to the discrepancy, demonstrating a true understanding of experimental physics.