Doppler Radar Cincinnati Ohio: Live Weather Guide
When severe storms roll off the Great Plains or winter weather rides up the Ohio River, tracking live doppler radar cincinnati ohio feeds becomes an essential daily routine. The Cincinnati metropolitan area, affectionately known as the Tri-State, sits at a turbulent atmospheric crossroads where humid air from the Gulf of Mexico collides with dry, cold Canadian air masses. Having a working understanding of local radar coverage helps you anticipate dangerous thunderstorms, flash flooding, and hazardous winter commutes long before the first drop or flake hits the ground.
The Backbone of Cincinnati Radar: Station KILN
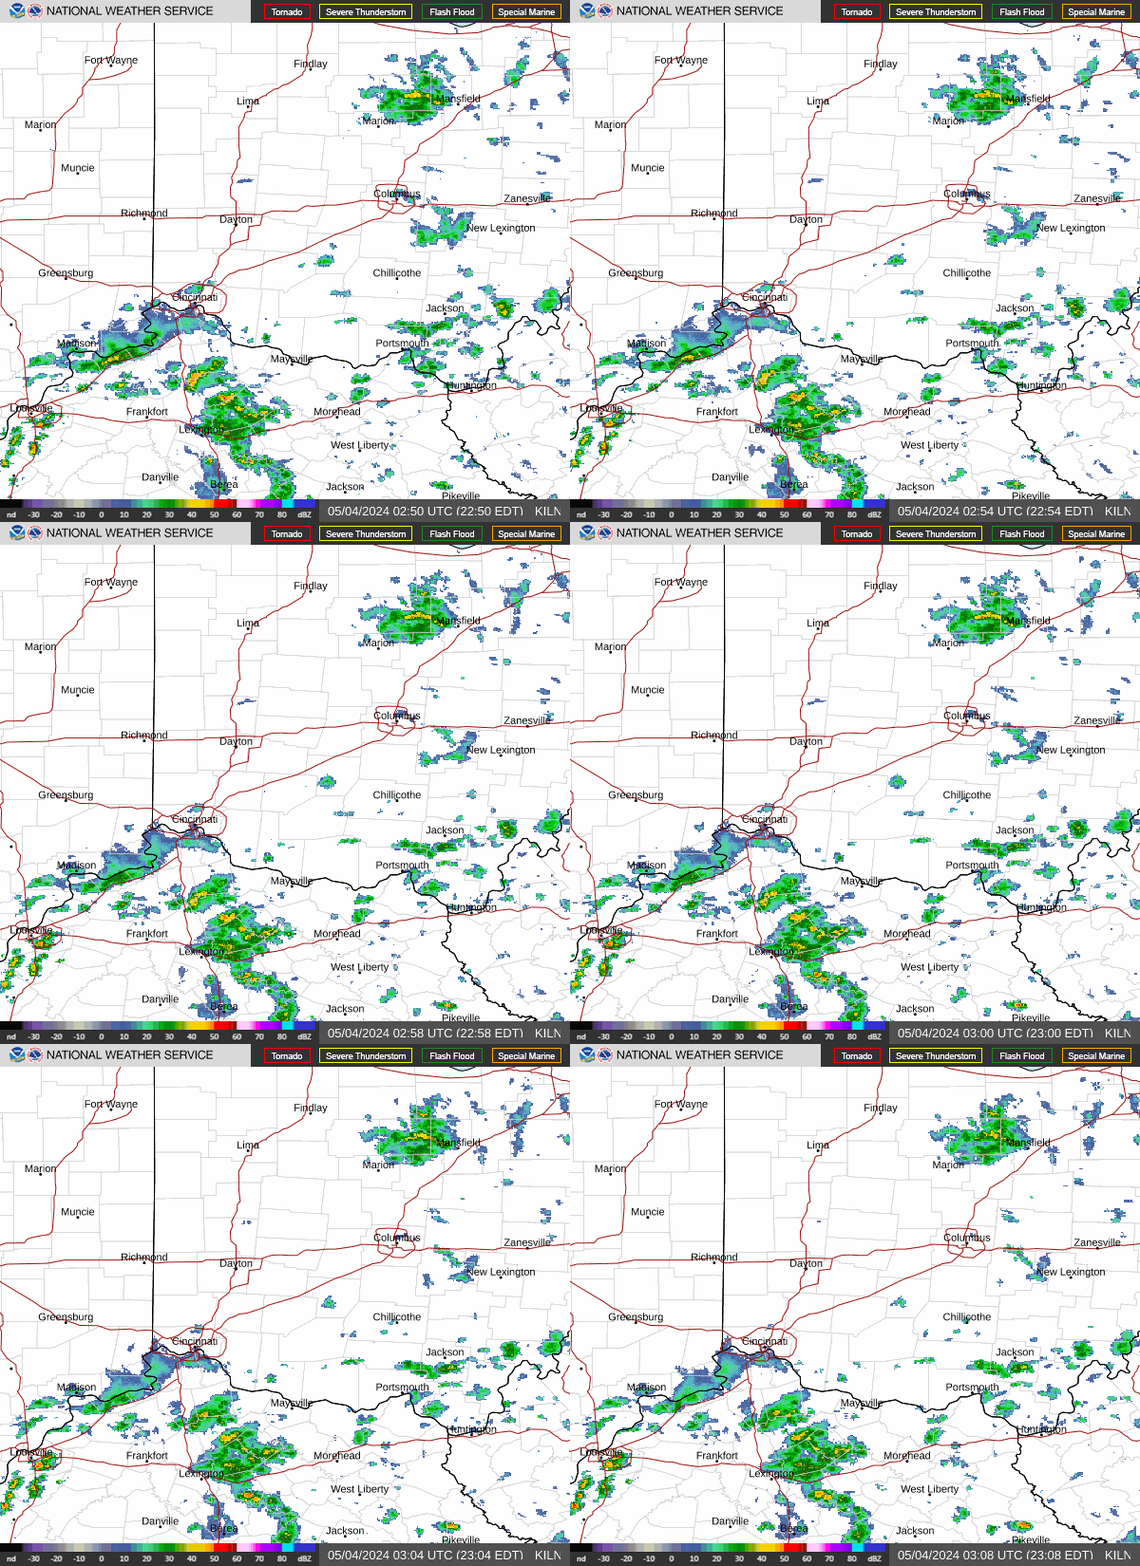
Many residents assume Cincinnati has a high-powered radar tower standing directly downtown. In reality, the primary National Weather Service (NWS) NEXRAD radar serving the Queen City is located roughly 40 miles northeast in Wilmington, Ohio. Operating under the station identifier KILN, this WSR-88D dual-polarization radar covers southwestern Ohio, northern Kentucky, and southeastern Indiana.
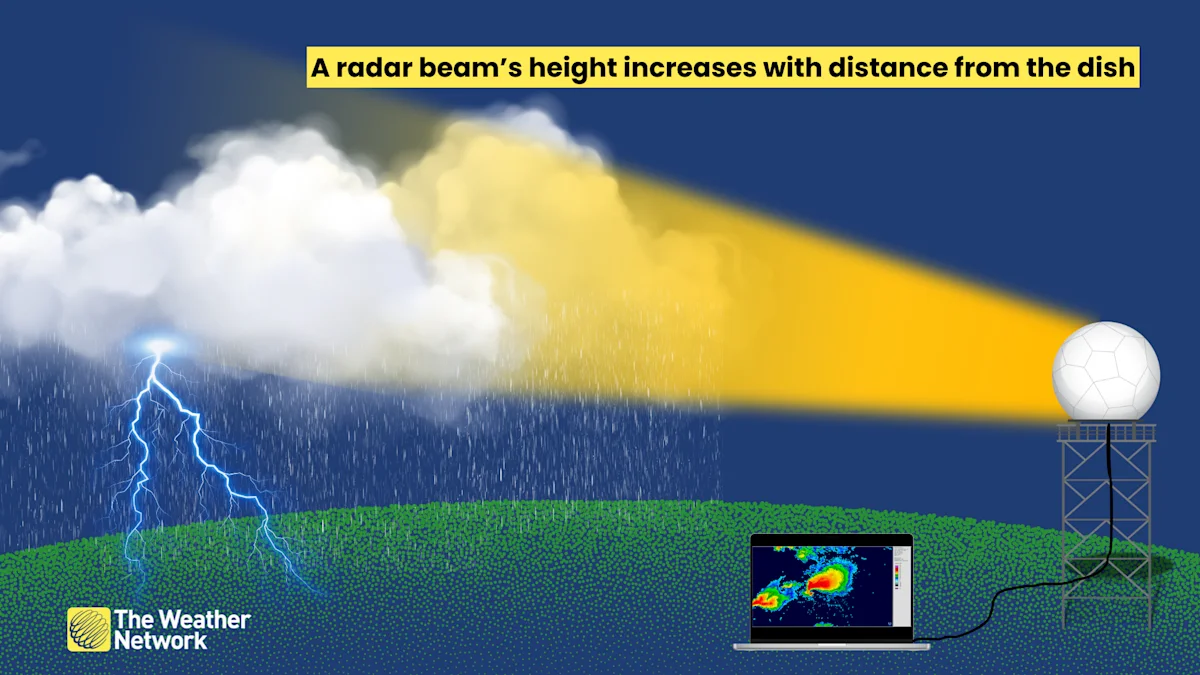
Because radar beams travel in straight lines while the Earth curves beneath them, a beam tilts higher into the atmosphere the farther it travels from the antenna:
- Beam Height Over Cincinnati: By the time KILN's lowest radar tilt reaches downtown Cincinnati and Hamilton County, the beam is scanning roughly 1,500 to 2,500 feet above ground level.
- Detection Capabilities: This beam height easily captures heavy downpours, mature thunderstorm cores, and rotating supercells. However, it can occasionally overshoot very low-level rotation or shallow winter drizzle.
- Adjacent Radar Overlap: During high-impact severe events, meteorologists supplement KILN with surrounding radars, including KIND (Indianapolis), KLVX (Louisville), and KILX (Lincoln, Illinois), to fill coverage gaps and view storm architecture from multiple angles.
The CVG Terminal Doppler Weather Radar (TDWR)
Cincinnati is also home to a specialized supplemental radar: the TCVG Terminal Doppler Weather Radar, positioned near Cincinnati/Northern Kentucky International Airport (CVG) in Hebron, Kentucky. Designed specifically by the Federal Aviation Administration (FAA) to protect air traffic, TDWR operates on a narrower C-band frequency.
While TDWR scans a shorter overall distance and suffers from precipitation attenuation (where heavy rain absorbs the beam), it provides exceptional, rapid low-level scans right over the airport and surrounding river valleys. For residents in Boone, Kenton, and southern Hamilton counties, TDWR data offers an ultra-crisp view of microbursts, wind shifts, and low-level storm rotation.
How to Read Doppler Radar Cincinnati Ohio Feeds
Modern interactive radar maps offer far more than just green and red blobs indicating rain. To get the most accurate picture of approaching weather, you should understand the primary radar products available on public feeds and weather apps.
Base Reflectivity vs. Composite Reflectivity
Base Reflectivity shows the intensity of precipitation returned from a single tilt of the radar antenna (typically the lowest angle, 0.5 degrees). This product represents what is happening closest to the surface, making it the most reliable view for assessing when rain or snow will actually reach your neighborhood.
Composite Reflectivity, on the other hand, compiles the maximum return value across every scan angle in a volume scan. While it can make storms look larger or more menacing than they appear at ground level, composite reflectivity is ideal for spotting developing updrafts, suspended hail cores, and storm structure high in the clouds.
Base Velocity and Storm Relative Motion
Doppler radar calculates the frequency shift of reflected radio pulses to measure wind speed and direction relative to the radar dish. On standard velocity displays:
- Green pixels: Winds moving toward the radar site (inbound).
- Red pixels: Winds moving away from the radar site (outbound).
When bright green and bright red colors appear tightly packed side-by-side, meteorologists call this a "velocity couplet." In a supercell, this signature indicates rapid rotation and a potential tornado. In straight-line wind scenarios, large swathes of uniform high velocity reveal damaging downbursts rushing ahead of a squall line.
Dual-Polarization and Correlation Coefficient (CC)
All NEXRAD systems transmit horizontal and vertical pulses simultaneously. This dual-polarization technology allows the radar to evaluate the physical shape of targets in the air. The Correlation Coefficient (CC) product measures how uniform those targets are. Pure raindrops or snowflakes produce a very high CC (0.95 to 1.0). If a tornado lofts irregular materials—such as wood, insulation, shingles, and vegetation—the CC value plunges dramatically. A localized drop in CC co-located with a velocity couplet confirms a "Tornado Debris Signature" (TDS), proving to meteorologists that a tornado is actively on the ground causing damage.
Local Weather Hazards in the Ohio Valley
Cincinnati weather is famously volatile, and interpreting radar requires factoring in local geography. The Ohio River Valley creates microclimates and sharp boundary layers that frequently influence storm behavior.
The I-71 Rain/Snow Transition Zone
Winter storms tracking across Kentucky and southern Ohio frequently place Cincinnati right along the freezing line. A temperature swing of just two degrees between the river valley and the northern suburbs (such as West Chester or Mason) can mean the difference between wet roads and thick ice or heavy wet snow. On radar, a phenomenon known as the "bright band"—caused by melting snowflakes coating in water and reflecting intensely—often flags the exact boundary where snow transitions into sleet and rain aloft.
Spring and Summer Squall Lines (QLCS)
Many of the Tri-State's severe weather events arrive as Quasi-Linear Convective Systems (QLCS), commonly known as squall lines. These organized lines of storms frequently produce bow echoes—radar formations that bend outward like an archer's bow. Bow echoes signify intense localized rear-inflow jets capable of producing 60 to 80 mph straight-line winds and brief, spin-up tornadoes that develop quickly along the leading edge.
River Valley Flash Flooding
Cincinnati's steep hills and winding creek systems (including the Little Miami, Great Miami, and Mill Creek basins) make the region susceptible to flash flooding. When storm cells "train"—repeating the same path over identical areas like train cars on tracks—Doppler radar dual-pol quantitative precipitation estimates (QPE) alert forecasters to rainfall accumulation rates exceeding two inches per hour, triggering critical flood advisories.
Where to Access Reliable Cincinnati Doppler Feeds
For the clearest, most actionable radar data, avoid generic smartphone weather apps that smooth imagery or introduce long refresh delays. Instead, turn to dedicated sources:
- NWS Wilmington (weather.gov/iln): The definitive source for raw WSR-88D data, local storm warnings, and detailed meteorological discussions tailored specifically to southwestern Ohio.
- Specialized Radar Apps (RadarScope, RadarOmega): Used by storm spotters, emergency managers, and meteorology enthusiasts, these apps deliver un-smoothed Level 2 and Level 3 NEXRAD data directly from KILN and TCVG with real-time velocity, CC, and warning polygon overlays.
- Local Tri-State Broadcast News: Cincinnati's local stations (WLWT, WCPO, WKRC, and FOX19) maintain dedicated weather teams who translate complex radar dynamics into practical street-level forecasts during severe weather coverage.
Staying Prepared
Doppler radar is one of the most powerful weather safety tools at your disposal, but it works best when combined with real-time situational awareness. Never wait until a storm appears overhead on radar before taking shelter. Always verify the radar timestamp to ensure your data feed has not lagged, maintain multiple ways to receive National Weather Service alerts (such as a NOAA Weather Radio), and use live radar tracking to protect your home, family, and travel plans across the Queen City.