Get Free Reading Fluency Graphs for Back to School
The beginning of a new academic year brings a flurry of lesson planning, classroom organizing, and diagnostic assessments. As educators welcome a fresh roster of learners, establishing a clear picture of each student’s reading abilities is top priority. If you want to streamline your assessment routine this fall, a practical strategy is to get free reading fluency graphs for back to school to transform abstract performance metrics into dynamic, visual roadmaps for student growth.

Oral reading fluency—the ability to read text accurately, quickly, and with appropriate expression—serves as a vital bridge between basic word recognition and deep reading comprehension. When students track their fluency visually on a graph, they gain immediate insight into their progress, boosting both motivation and academic accountability.
Why Visual Fluency Tracking Matters in Literacy Instruction
Many elementary and middle school students struggle to understand abstract numbers. Telling a third-grader that their reading rate is 65 Words Correct Per Minute (WCPM) rarely carries meaning. However, when that student plots 65 WCPM on a chart and compares it visually against a winter goal line of 90 WCPM, the metric transforms into an actionable, personal target.
Research consistently highlights the benefits of student self-monitoring. Integrating visual progress monitoring into your reading block provides distinct instructional advantages:
- Fosters Growth Mindset: Students shift their focus away from competing against peers and toward beating their own previous scores.
- Provides Objective RTI/MTSS Data: Visual charts offer instant, clear documentation for Multi-Tiered System of Supports (MTSS) meetings and special education referrals.
- Enhances Metacognition: Plotting data prompts students to reflect on why a score changed—whether due to decoding unfamiliar multi-syllabic words or rushing through punctuation.
- Simplifies Family Communication: Parents can see trajectory lines at a glance during parent-teacher conferences, eliminating confusion over literacy progress.
Where to Get Free Reading Fluency Graphs for Back to School
You do not need to spend money on expensive commercial assessment software or subscription platforms to implement effective fluency tracking. High-quality printable and digital graphing tools are widely available across reputable educational platforms.
1. Open-Access Literacy Centers
Organizations like the Florida Center for Reading Research (FCRR) offer open-access student center activities that frequently include student data recording sheets and bar graphs. These resources are research-backed, grade-differentiated, and completely free to download in PDF format.
2. Intervention Central
Intervention Central provides free tools and charting resources designed specifically for Response to Intervention (RTI). Their downloadable chart templates allow teachers to plot baseline scores, aimlines, and weekly progress monitoring data points for both general education and targeted intervention groups.
3. Educational Resource Exchanges (Free Filter)
Platforms like Teachers Pay Teachers (TpT) host thousands of educator-created tracking sheets. By setting the search filter to "Free," you can download customizable printable bar charts, seasonal tracking forms, and digital Google Sheets templates designed specifically for back-to-school baseline setups.
4. DIY Digital Spreadsheets
If you prefer paperless tracking, free cloud platforms like Google Sheets or Microsoft Excel allow you to build custom fluency dashboards in minutes. By creating a two-column sheet (Date and WCPM), the built-in chart generator will automatically generate a dynamic line graph that updates each time a student enters a new timing score.
Video: Reading Fluency Graph
Key Features of an Effective Fluency Graph
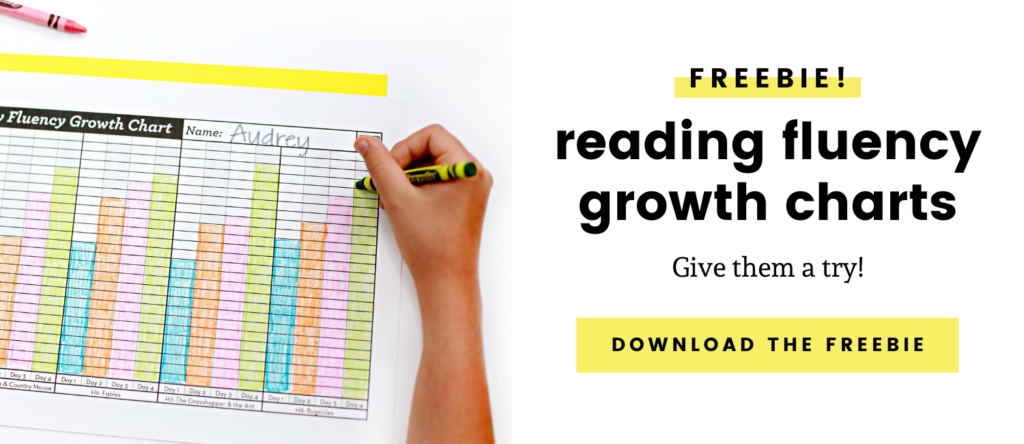
Not every fluency graph fits every grade level. When selecting or designing templates for your classroom this year, look for these essential design components:
- Appropriate Scale: For early readers (Grades 1–2), choose graphs scaled from 0 to 100 or 120 WCPM in increments of 5 or 10. For upper elementary and middle school readers, select graphs scaled up to 180 or 200 WCPM. Overly compressed scales make small gains hard to see, which deflates student motivation.
- Baseline and Benchmark Indicators: An effective chart includes a dedicated space to record the initial fall baseline as well as a pre-drawn horizontal line indicating national end-of-year benchmark expectations (such as the Hasbrouck-Tindal oral reading fluency norms).
- Accuracy or Error Tracking: Speed alone does not equate to fluency. High-quality charts provide a secondary line or check-box section to track total errors, encouraging readers to balance speed with accuracy.
- Student-Friendly Visuals: Especially in primary grades, bar graphs that students can color in with crayons or markers are far more engaging than complex coordinate plane charts.
How to Launch Fluency Tracking in the First 30 Days of School
Setting up your tracking system early ensures consistent data collection throughout the school year. Follow this four-step sequence to introduce fluency graphing smoothly:
Step 1: Administer an Unrehearsed Baseline (Cold Read)
During the second or third week of school, conduct a one-minute cold read assessment using a grade-level passage. Calculate the student’s WCPM by subtracting the number of errors from the total number of words read in 60 seconds. This initial score forms the anchor point on the graph.
Step 2: Establish Realistic, Data-Driven Goals
Review the baseline score privately with the student. Consult standard fluency benchmarks—for example, the typical beginning-of-year target for a second-grader is roughly 50–60 WCPM, while a fourth-grader begins around 85–95 WCPM. Help the student set an achievable growth target, typically aiming for an increase of 1 to 1.5 words per week.
Step 3: Teach the Mechanics of Self-Graphing
Dedicate one mini-lesson to demonstrating how to plot points or color in bars. Model how to locate the vertical axis (words per minute) and the horizontal axis (test dates or passage numbers). Giving students direct ownership over charting transforms data collection from a passive evaluation into an active learning milestone.
Step 4: Incorporate Repeated Reading Routines
Fluency graphs work best alongside a systematic repeated reading protocol. Have students conduct a "cold read" on Monday, practice the passage throughout the week using paired reading, echo reading, or audio-assisted reading, and then record their final "hot read" on Friday. Showing both the cold score and the hot score on the same chart visually proves the direct relationship between deliberate practice and improved fluency.
Best Practices for Classroom Data Management
Maintaining privacy is vital when tracking student performance. While public classroom charts can be motivating for top readers, they can cause anxiety and shame for struggling students. Always keep fluency graphs inside individual student data binders, private reading folders, or password-protected digital portfolios.
Set a consistent schedule for updates. Progress monitoring every 7 to 14 days gives students enough practice to demonstrate measurable progress without overwhelming your instructional schedule with constant testing.
Start the School Year with Clear Vision
Fluency is not the end goal of reading, but it is the gatekeeper to reading comprehension. When automatic word recognition is achieved, cognitive capacity is liberated for analytical thinking and textual enjoyment. Equipping your classroom with clean, structured fluency graphs during back-to-school season gives your students a clear, visual compass for their reading journey all year long.


