Interpreting Bond Rate Graphs Like a Pro
Decoding the Fixed-Income Market
For many retail investors, the stock market gets all the attention, but the bond market is where the smart money really watches. Fixed-income securities dictate the cost of borrowing for corporations, governments, and consumers worldwide. However, if you look at a standard financial chart, price and yield often move in opposite directions, creating a visual maze for the untrained eye. Knowing the Insider Secrets to Interpreting Bond Rate Graphs Like a Pro can give you an edge, helping you anticipate economic recessions, interest rate cuts, and equity market corrections long before they happen.
Bond rate graphs are essentially visual representations of debt yields across different maturities. Unlike stock charts that simply track upward or downward momentum based on corporate earnings, bond charts reflect macroeconomic sentiment, inflation expectations, and central bank policy. To read them effectively, you must understand the underlying mechanics of yields, durations, and yield curve geometry.
The Inverse Relationship: Price vs. Yield
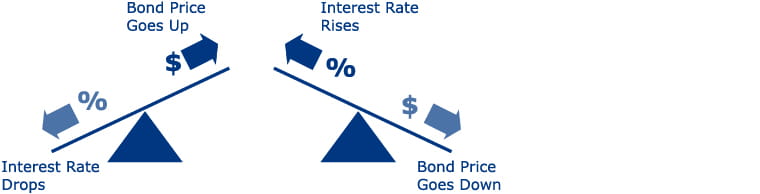
The single most important rule in fixed-income analysis is that bond prices and bond yields move inversely. When interest rates rise, existing bonds with lower payouts become less attractive, causing their market prices to fall. Conversely, when interest rates drop, older bonds paying higher rates surge in value.
Why This Matters on a Chart
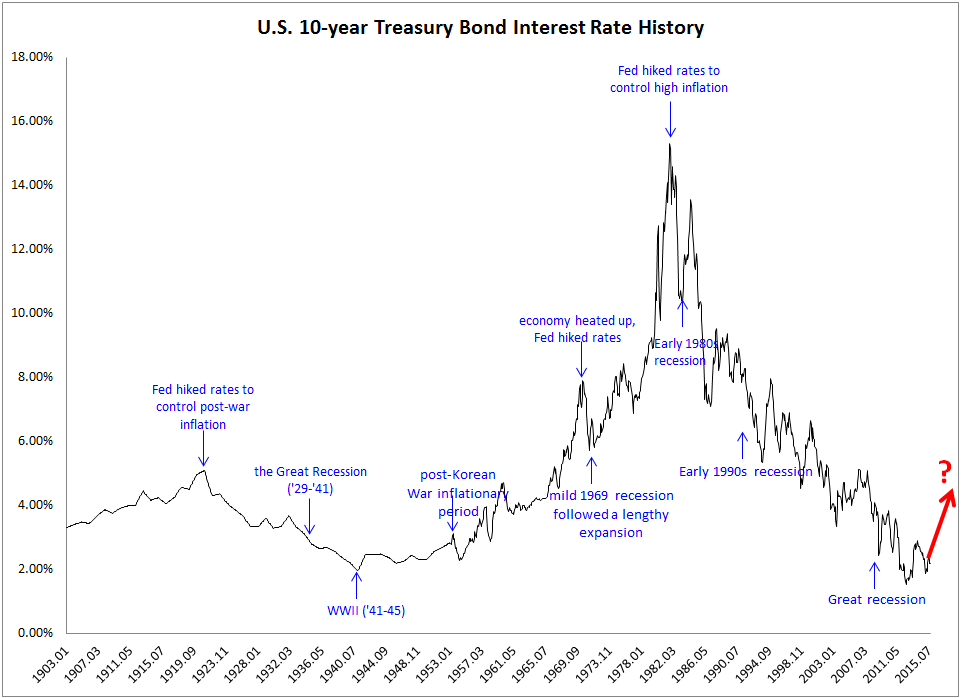
When you pull up a standard bond chart (such as the 10-Year U.S. Treasury yield), you are looking at the yield, not the price. If the line is trending upward, it means bond prices are falling and borrowing costs are rising. Recognizing this distinction prevents you from making the classic mistake of thinking a rising chart means fixed-income assets are gaining value for current holders.
- Rising Yield Line: Interest rates are going up; existing bond prices are dropping.
- Falling Yield Line: Interest rates are going down; existing bond prices are rising.
- Flat Yield Line: Market expectations are currently stable regarding future monetary policy.
Anatomy of the Yield Curve
A yield curve is a specific type of graph that plots the yields of bonds of identical credit quality against differing maturity dates, ranging from one month to thirty years. Normally, the curve slopes upward, reflecting the reality that investors demand a higher return for tying up their capital for longer periods of time.
Professional traders look at the shape of this curve to gauge the health of the economy. When the curve shifts, it tells a compelling story about where capital is flowing.
The Normal vs. Steep Yield Curve

A normal yield curve slopes gently upward from left to right. This indicates a healthy, growing economy where inflation is moderate, and the Federal Reserve is maintaining neutral interest rates. A steep yield curve, on the other hand, occurs when long-term yields rise much faster than short-term yields. This usually signals that investors expect robust economic growth and higher inflation in the future, prompting them to demand a larger risk premium for long-term debt.
Spotting Warning Signs: The Inverted Yield Curve
One of the most powerful insider secrets in technical bond analysis is recognizing an inverted yield curve. This occurs when short-term interest rates exceed long-term rates. On a graph, the line slopes downward from left to right—an abnormal market condition.
Historically, an inversion of the 2-year and 10-year Treasury spread has been one of the most reliable leading indicators of a recession. When institutional investors rush to lock in long-term yields because they expect the central bank to slash rates in the near future due to economic distress, long-term yields plummet below short-term rates.
- Identify the Spread: Compare the yield of the 2-year Treasury note to the 10-year Treasury note.
- Check for Inversion: If the 2-year yield is higher than the 10-year yield, the curve is inverted.
- Measure the Duration: A brief dip might be market noise, but a sustained inversion historically precedes an economic downturn by 6 to 18 months.
Using Moving Averages and Momentum Indicators
While macroeconomists look at yield curves, technical traders apply traditional charting indicators to bond rate graphs to time their entry and exit points. Moving averages (such as the 50-day and 200-day exponential moving averages) are heavily relied upon in the fixed-income space.
Identifying Breakouts and Reversals
Bond yields often consolidate within tight ranges for months before breaking out due to unexpected employment reports, consumer price index (CPI) releases, or geopolitical events. By overlaying the Relative Strength Index (RSI) or MACD (Moving Average Convergence Divergence) onto a Treasury yield chart, you can spot overbought or oversold conditions. If a yield chart hits a strong historical resistance level and forms a bearish reversal pattern, it often signals a peak in interest rates—the exact moment savvy investors pivot heavily into long-duration bonds for capital appreciation.
Putting It All Together for Your Portfolio
Mastering bond rate graphs transforms how you view the entire financial landscape. You no longer react solely to stock market headlines; instead, you track the foundational debt instruments that quietly drive global liquidity. By keeping an eye on the inverse relationship between price and yield, monitoring the steepness of the yield curve, and watching for technical breakouts, you can position your portfolio ahead of economic shifts rather than reacting to them after the fact.