Learn to Read the Language of Elements in Printable Periodics
A printed chemistry chart is often one of the first resources placed inside a science binder or taped above a laboratory bench. At first glance, it looks like a cryptic checkerboard of two-letter abbreviations, decimal numbers, and shifting colors. However, once you learn to read the language of elements in printable periodics, this static grid transforms into an elegant, highly organized cheat sheet for the physical universe.

Dmitri Mendeleev published his first coherent periodic arrangement in 1869, organizing elements by atomic mass and recurring chemical properties. Modern tables organize elements by atomic number—the number of protons within an atom's nucleus. Every position, margin, and typographic mark on a standard printable periodic table carries precise meaning. Understanding how to decode these details will save hours of rote memorization and help you quickly predict how atoms interact.
The Anatomy of an Element Tile
Most printable periodic tables dedicate an individual square or “cell” to each element. While designs vary based on the table's intended audience, standard reference sheets consistently present four core data points, along with a few advanced indicators.
1. Atomic Number
Positioned prominently at the top or corner of the tile, the atomic number (designated mathematically as Z) indicates the total count of protons found in an atom's nucleus. Because neutral atoms contain an equal count of protons and electrons, this integer also reveals the element's electron population. The table advances sequentially across rows based on this single number: Hydrogen is 1, Helium is 2, Lithium is 3, and so forth.
2. Chemical Symbol
The large, centralized abbreviation is the element's chemical symbol. It consists of one capital letter, sometimes followed by a single lowercase letter. While many symbols directly match their modern English names (such as C for Carbon or O for Oxygen), several common elements derive their symbols from ancient Latin or Greek terms:
- Fe (Iron): from ferrum
- Na (Sodium): from natrium
- K (Potassium): from kalium
- Au (Gold): from aurum
- Ag (Silver): from argentum
- Pb (Lead): from plumbum
3. Element Name
Directly beneath the symbol, most printable reference sheets provide the full standardized name recognized by the International Union of Pure and Applied Chemistry (IUPAC). This prevents confusion between similar symbols, such as Magnesium (Mg) and Manganese (Mn).
4. Atomic Mass
Usually printed as a decimal below the name, standard atomic weight represents the weighted average mass of an element's naturally occurring isotopes, measured in unified atomic mass units (u). If an element is represented by a single integer inside brackets—such as [98] for Technetium—it indicates that the element lacks stable isotopes, showing instead the mass number of its longest-lived radioactive isotope.
5. Secondary Metrics on Advanced Printouts
Specialized printable periodics designed for university or laboratory use frequently pack additional data into each cell:
Video: How to Read the Periodic Table
- Electronegativity: Pauling-scale values indicating an atom's tendency to attract shared electrons in a bond.
- Common Oxidation States: Numbers denoting typical electrical charges when an atom forms ionic compounds.
- Condensed Electron Configuration: A shorthand representation (e.g., [Ne] 3s² 3p⁴) showing the distribution of electrons in energy levels.
The Structural Map: Periods, Groups, and Blocks
The physical geometry of a printable chart conveys as much scientific information as the individual numbers inside the tiles. The table is systematically structured across two axes: horizontal rows and vertical columns.
Periods Reveal Electron Shells
The seven horizontal rows are called periods. As you read across a period from left to right, each step adds one proton to the nucleus and one electron to the outer shell. More importantly, the period number indicates the highest principal energy level occupied by electrons in an unexcited atom. Period 1 elements (Hydrogen and Helium) fill only their first electron shell, while Period 4 elements distribute electrons across four shells.
Groups Dictate Chemical Families
The 18 vertical columns are known as groups or families. Elements inside the same group share identical valence (outermost) electron configurations. Because valence electrons control chemical bonding, members of a group behave almost identically in chemical reactions:
- Group 1 (Alkali Metals): Highly reactive, soft metals with one valence electron that form +1 cations.
- Group 2 (Alkaline Earth Metals): Reactive metals with two valence electrons that readily form +2 ions.
- Groups 3–12 (Transition Metals): Tough, high-density elements with complex valence shells that often exhibit multiple oxidation states.
- Group 17 (Halogens): Reactive nonmetals needing just one electron to achieve stability, forming -1 salts.
- Group 18 (Noble Gases): Chemically inert gases featuring completely filled valence shells.
The Subshell Blocks
Periodic charts are also split into four distinct geometric blocks—s, p, d, and f—corresponding to the atomic subshell being populated with electrons. Printable study sheets frequently color-code these blocks:
- s-block: Groups 1 and 2, plus Helium.
- p-block: Groups 13 through 18.
- d-block: Groups 3 through 12 (transition metals).
- f-block: The two detached rows below the main grid (Lanthanides and Actinides), pulled out to keep the chart within manageable printing dimensions.
Why You Should Learn to Read the Language of Elements in Printable Periodics
When you commit time to learn to read the language of elements in printable periodics, you eliminate the need to memorize thousands of isolated scientific facts. The layout acts as an analog computer that allows you to calculate and predict natural phenomena on sight.
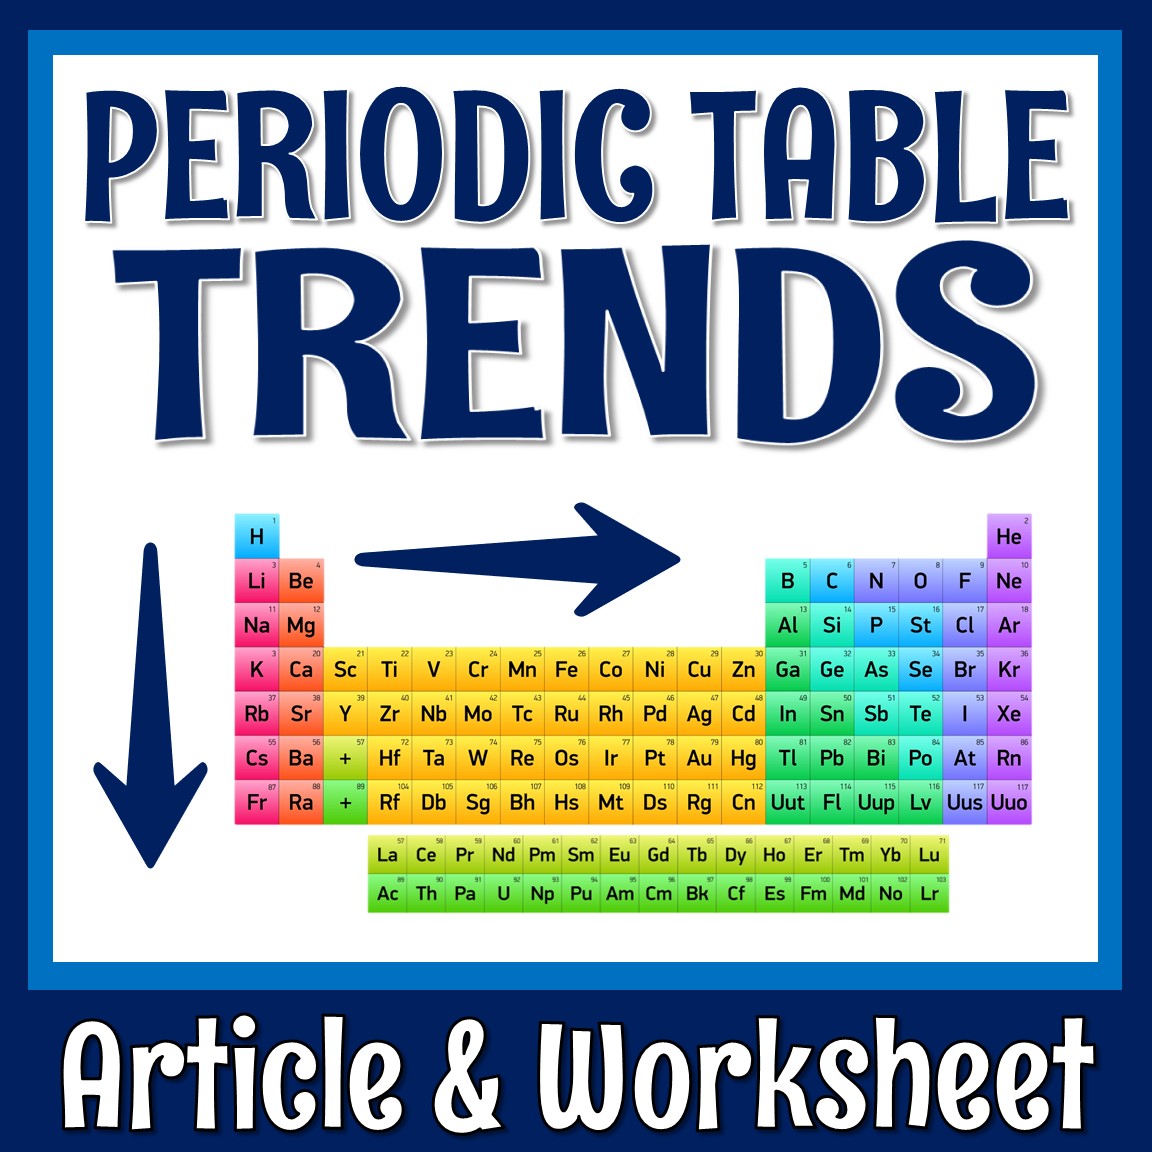
Periodic trends—gradual shifts in physical and chemical attributes across the chart—are easily visualized on a printed layout:
- Atomic Radius: Atoms grow physically smaller as you move from left to right across a period because additional nuclear charge pulls electrons tighter. They grow larger as you move downward through a group due to the addition of complete electron shells.
- Ionization Energy: The energy needed to strip an electron away increases from left to right and decreases from top to bottom.
- Electronegativity: Follows the same diagonal vector as ionization energy, peaking at Fluorine in the top right (excluding noble gases) and dropping to its lowest value at Francium in the bottom left.
- Metallic Character: Increases toward the bottom-left corner and decreases toward the top-right.
How to Use and Annotate Printable Periodics for Active Learning
Digital interactive tables are convenient for quick searches, but tactile, printable periodic sheets offer distinct advantages for deep study and exam prep. You can annotate, highlight, and customize a paper chart according to your current coursework.
- Draw the Metalloid Staircase: Use a bold pen to trace the staircase border starting between Boron and Aluminum down to Polonium and Astatine. This clearly separates conductors (metals to the left) from insulators (nonmetals to the right).
- Annotate Trend Vectors: Sketch directional arrows along the margins for electronegativity, atomic size, and electron affinity. Seeing these cues while completing problem sets cements spatial memory.
- Color-Code Physical States: On a monochrome printout, use three colored highlighters to mark elements that are solids, liquids (Bromine and Mercury), and gases at standard room temperature.
- Keep One Clean and One Marked: Print two copies. Keep one fully annotated for active problem-solving, and use a pristine, bare-bones copy to test your recall of groups, charges, and periodic trends before test day.
By translating the letters, integers, and positions into functional chemistry concepts, you unlock the underlying logic of matter. The periodic table ceases to be an arbitrary chart to memorize; it becomes an intuitive blueprint for the elements that shape our world.


