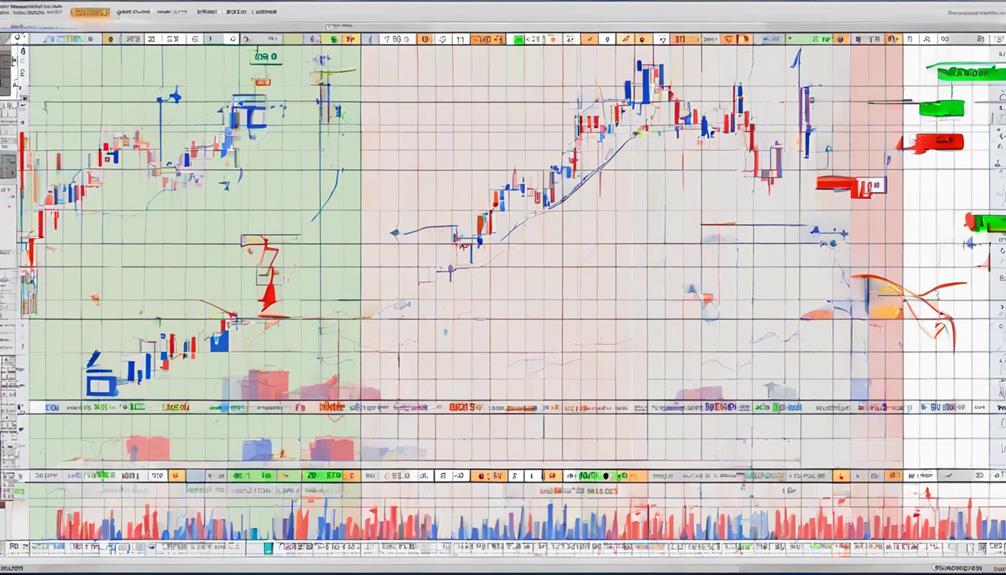
Mastering the Mobius Trend Pivots Strategy
Navigating financial markets requires robust tools to filter out market noise and identify genuine turning points. While many traders rely on standard moving averages or classic oscillators, advanced methodologies offer deeper insights into momentum shifts. One such approach gaining traction among technical analysts is the mobius trend pivots strategy, designed to pinpoint trend exhaustion and capture early reversal entries.
By blending price action with specific pivot identification formulas, this framework helps traders anticipate market direction changes rather than chasing lagging indicators. In this guide, we will break down the mechanics of the strategy, how to set it up on your charts, and practical ways to manage risk.
Understanding Market Pivots and Momentum
Before diving into the specific mechanics of the Mobius approach, it is essential to understand what a pivot represents in technical analysis. A pivot is a significant high or low where the balance of power between buyers and sellers shifts. In a healthy uptrend, price prints higher highs and higher lows. When that structure breaks, a potential pivot occurs.
Traditional pivot points rely heavily on the previous day's high, low, and close. However, modern trend-pivoting techniques incorporate momentum oscillators—such as the Relative Strength Index (RSI) or MACD—alongside price extremes to confirm whether a pivot is actionable or merely a minor retracement.
Core Components of the Mobius Trend Pivots Strategy
Implementing this trading framework effectively requires a structured approach to chart setup and signal generation. Below are the foundational elements you need to integrate into your trading platform.
1. Chart Setup and Indicators
To execute the strategy, configure your charts with the following tools:
- Candlestick Charts: Set to your preferred timeframe (best suited for swing trading on daily charts or active trading on 1-hour timeframes).
- Trend Pivot Indicator: A custom or built-in script that highlights fractal-based highs and lows (typically requiring a 5-bar or 3-bar confirmation).
- Momentum Filter: A dual-period Exponential Moving Average (EMA) crossover or an RSI indicator set to a 14-period lookback to measure overbought and oversold conditions.
2. Identifying Valid Pivot Points
A valid pivot under this strategy is not just any swing point. It must align with a structural break in the prevailing trend. For instance, in a downtrend, price usually makes lower lows. The strategy looks for a failure swing—where the asset fails to make a lower low and instead prints a higher low accompanied by bullish divergence on your momentum indicator.
Step-by-Step Execution Rules

Having the right indicators is only half the battle; execution dictates your long-term profitability. Follow these structured steps to execute trades using the setup.
- Wait for Trend Exhaustion: Monitor the asset as it tests major support or resistance levels. Look for slowing momentum candles, such as dojis or pin bars.
- Spot the Pivot Confirmation: Wait for the pivot indicator to officially print a reversal node. Do not enter mid-candle; wait for the bar to close.
- Check Momentum Alignment: Ensure that your secondary indicator confirms the shift. If you are buying a bullish pivot, RSI should be climbing out of oversold territory.
- An alternative entry involves waiting for a retest of the broken pivot level, confirming that former resistance has turned into support.
Risk Management and Stop Loss Placement
No technical strategy boasts a 100% win rate, making rigorous risk management non-negotiable. Protecting your capital ensures you survive periods of choppy market consolidation.
Setting Stop Losses
The beauty of trading with pivots is that structural invalidation levels are naturally clear. For a long trade triggered by a bullish pivot, place your stop loss a few ticks below the absolute low of that pivot candle. If price breaches this level, your thesis is invalidated, and you should exit immediately.
Defining Profit Targets
To maintain a favorable risk-to-reward ratio of at least 1:2 or 1:3, set your initial profit target at the next major swing high or resistance zone. Alternatively, you can scale out half your position at the first target and trail your stop loss beneath subsequent higher lows to capture extended market trends.
Common Pitfalls to Avoid
Even experienced traders occasionally misapply systematic trading frameworks. Keep these common mistakes in mind when trading trend pivots:
- Trading Against the Macro Trend: Attempting to catch bottom pivots in a deeply overselling, high-momentum bear market often leads to heavy losses. Always align your pivots with higher-timeframe structures.
- Ignoring Volume: Valid pivots are typically accompanied by a surge in volume, signaling institutional participation. Low-volume pivots frequently result in false breakouts.
- Over-Leveraging: Because pivot strategies rely on precise stop-loss placements, taking oversized positions can damage your account if consecutive false signals occur.
Conclusion
The mobius trend pivots strategy offers a systematic way to capitalize on market reversals by combining structural price points with momentum confirmation. By maintaining strict discipline, waiting for confirmed pivot closes, and employing strict risk management protocols, you can significantly enhance your technical trading edge. Test this strategy in a simulated environment first to adapt it to your specific asset class and risk tolerance.