Mastering the Quadrant One Graph: A Guide
When you look at charts showing company revenue, website traffic, or running speed over time, you are almost always viewing a quadrant one graph. While the complete Cartesian coordinate plane contains four distinct sections, Quadrant 1 is the workhorse of elementary mathematics, practical science, and business analytics. Because real-world measurements like time, distance, money, and quantity rarely drop below zero, isolating this single quadrant provides an intuitive, uncluttered view of strictly positive data.
Whether you are learning coordinate geometry for the first time, helping a student, or building charts for a report, understanding how to read and construct a graph in Quadrant 1 is an essential visual literacy skill.
The Geometry of the Cartesian Plane
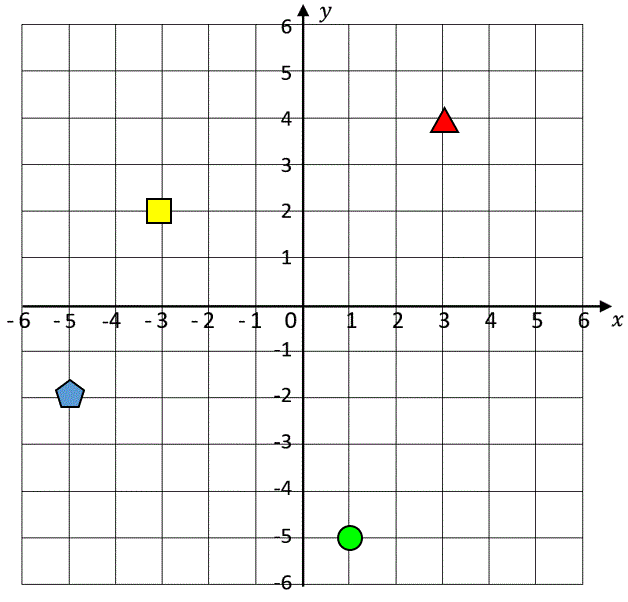
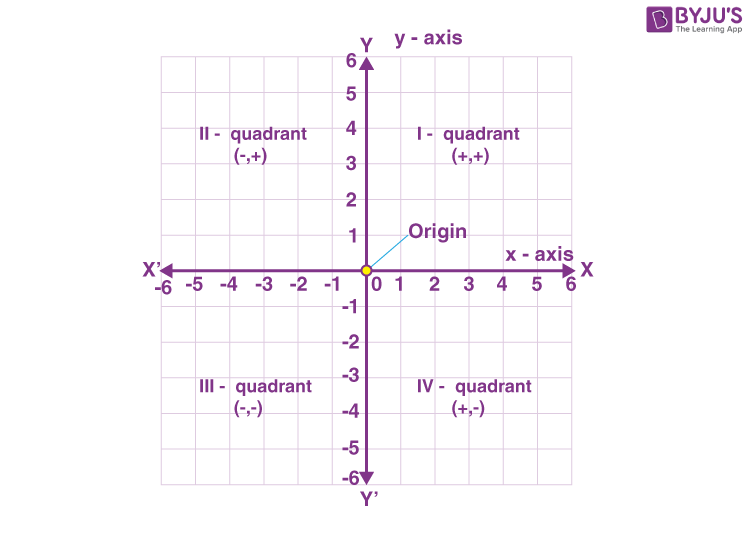
The standard Cartesian coordinate plane is created by the intersection of two perpendicular number lines: the horizontal x-axis and the vertical y-axis. These lines cross at a central anchor called the origin, represented by the ordered pair (0, 0).
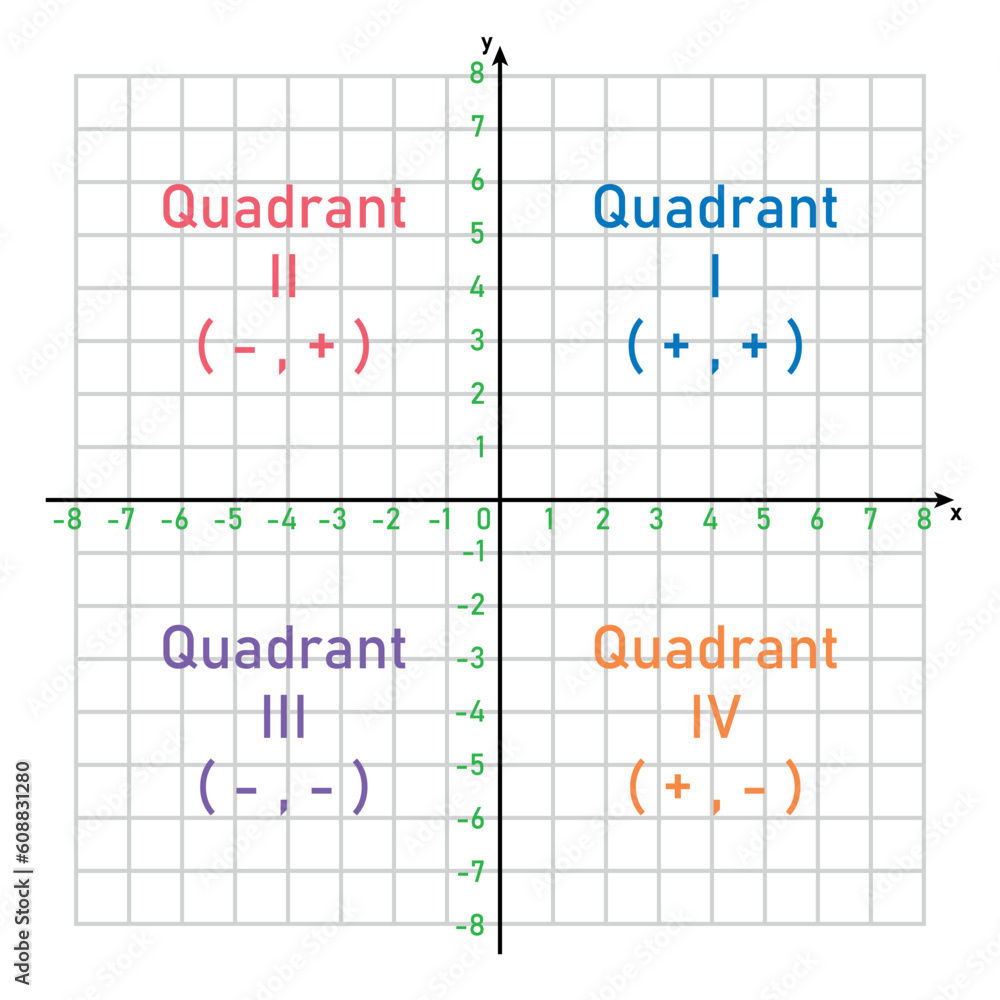
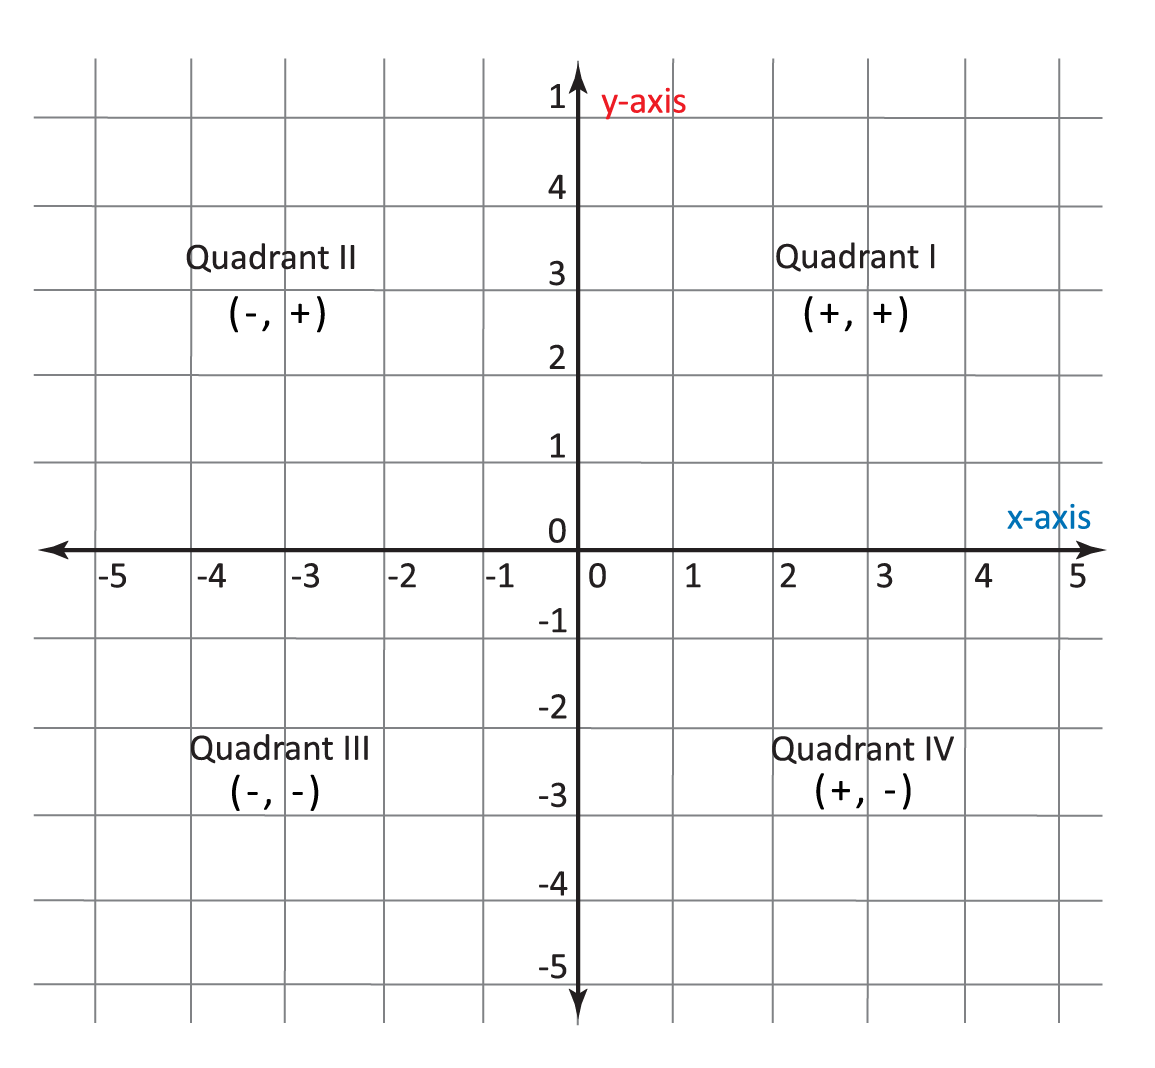
This intersection divides the two-dimensional space into four sections, conventionally numbered using Roman numerals in a counterclockwise rotation:
- Quadrant I (Upper Right): Both x and y are positive
(+x, +y). - Quadrant II (Upper Left): x is negative, y is positive
(-x, +y). - Quadrant III (Lower Left): Both x and y are negative
(-x, -y). - Quadrant IV (Lower Right): x is positive, y is negative
(+x, -y).
Because it occupies the upper-right corner, a graph focused strictly on this zone places the origin at the bottom-left corner of your page or screen, extending upward and to the right.
Key Features of a Quadrant One Graph
Focusing exclusively on positive values alters the visual framing of your grid. Instead of drawing a large cross in the center of the page, a quadrant one graph resembles an open "L" shape. Here are its defining anatomical elements:
1. The Origin (0, 0)
Located at the bottom-left vertex of the grid, the origin serves as the starting point for every point you locate. It represents zero on both the horizontal and vertical scales.
2. The Positive X-Axis
The horizontal line running along the bottom edge represents the independent variable. In Quadrant 1, values on this axis increase from left to right, starting at zero and moving toward positive infinity.
3. The Positive Y-Axis
The vertical line running up the left edge represents the dependent variable. Values on this axis increase from bottom to top, starting at zero and moving upward.
4. Positive Ordered Pairs
Every point plotted in Quadrant 1 is written as an ordered pair (x, y), where both values are greater than or equal to zero. If either coordinate were negative, the point would spill over into one of the other three quadrants.
How to Plot Points in Quadrant 1: Step-by-Step
Plotting points accurately relies on following a consistent directional routine. Remember the fundamental rule: horizontal movement always comes before vertical movement. Think of it like walking into an elevator before going up to your floor.
- Read the Ordered Pair: Look at your coordinates
(x, y). For this example, let's plot the point(4, 7). - Start at the Origin: Place your pencil tip or cursor at
(0, 0). Do not make a mark yet. - Move Along the X-Axis: Look at the first value (4). Move 4 units to the right along the horizontal line.
- Move Parallel to the Y-Axis: From that position on the x-axis, look at the second value (7). Move directly upward 7 units.
- Mark and Label: Draw a distinct dot at the intersection. Write the coordinates
(4, 7)or the corresponding letter label (e.g., Point A) adjacent to the dot.
Handling Points with Zero
Video: How to Plot Points on a Coordinate Plane (Quadrant 1) | Positive Coordinates | Math with Mr. J
Points with a coordinate of zero can sometimes confuse beginners. These points sit directly on the axes rather than in the open grid field:
- Point (5, 0): Start at the origin, move right 5 units, and move up 0 units. The point sits directly on the horizontal x-axis.
- Point (0, 6): Start at the origin, move right 0 units, and move up 6 units. The point sits directly on the vertical y-axis.
Why Quadrant 1 Dominates Real-World Applications
While theoretical physics and calculus make extensive use of all four quadrants, everyday practical data relies overwhelmingly on Quadrant 1. The reason is simple: physical reality rarely accommodates negative numbers for primary metrics.
Time and Distance
You cannot travel negative miles, nor can an event take negative seconds. In physics, when analyzing speed, velocity magnitude, or acceleration over elapsed time, time always starts at zero and proceeds forward along the x-axis, while distance accumulates along the y-axis.
Finance and Business Metrics
Most basic business reporting monitors metrics that cannot be negative in raw form:
- Customer Acquisition: Number of new signups (x) versus total advertising spend (y).
- Sales Volume: Units produced (x) versus total manufacturing cost (y).
- Website Analytics: Days of the month (x) versus page views (y).
While net profit can occasionally dip below zero (requiring Quadrant 4), revenue, user counts, and transaction volumes remain firmly rooted in Quadrant 1.
Health and Biology
Pediatric growth charts, dosage titration tables, and plant growth tracking graphs all operate in Quadrant 1. A child's age (x) and height (y), or sunlight hours (x) and leaf count (y), are inherently positive measurements.
Common Graphing Mistakes to Avoid
Even though Quadrant 1 is the simplest quadrant to navigate, simple oversights can distort your data or lead to incorrect answers on exams.
1. Swapping X and Y Coordinates
The most frequent error is reversing the axes—moving up first and right second. Plotted incorrectly, (2, 5) becomes (5, 2), placing your point in an entirely different position and distorting any trendline you intend to draw.
2. Inconsistent Axis Intervals
Each grid square along an axis must represent the exact same increment. If your first grid mark represents 2 units, the second must represent 4, the third 6, and so on. While the x-axis and y-axis can use different scales from each other (e.g., x counting by 1s and y counting by 10s), each individual axis must remain perfectly consistent across its entire length.
3. Omitting Axis Labels and Units
A graph without labels is just an abstract collection of dots. Always label the x-axis (e.g., "Time in Hours") and the y-axis (e.g., "Distance in Miles"). Clear units prevent ambiguity and make the relationship between the two variables immediately understandable.
Summary Checklist for Your Graph
Before finalizing any chart or homework problem based in Quadrant 1, run through this quick checklist:
- Is the origin
(0, 0)clearly anchored at the lower left? - Are your numbers evenly spaced along both axes?
- Did you follow the (Horizontal, Vertical) order for every point?
- Are your axes clearly titled with names and measurement units?
Mastering this single quadrant establishes the foundational muscle memory required for advanced coordinate geometry, algebraic functions, and data analysis.