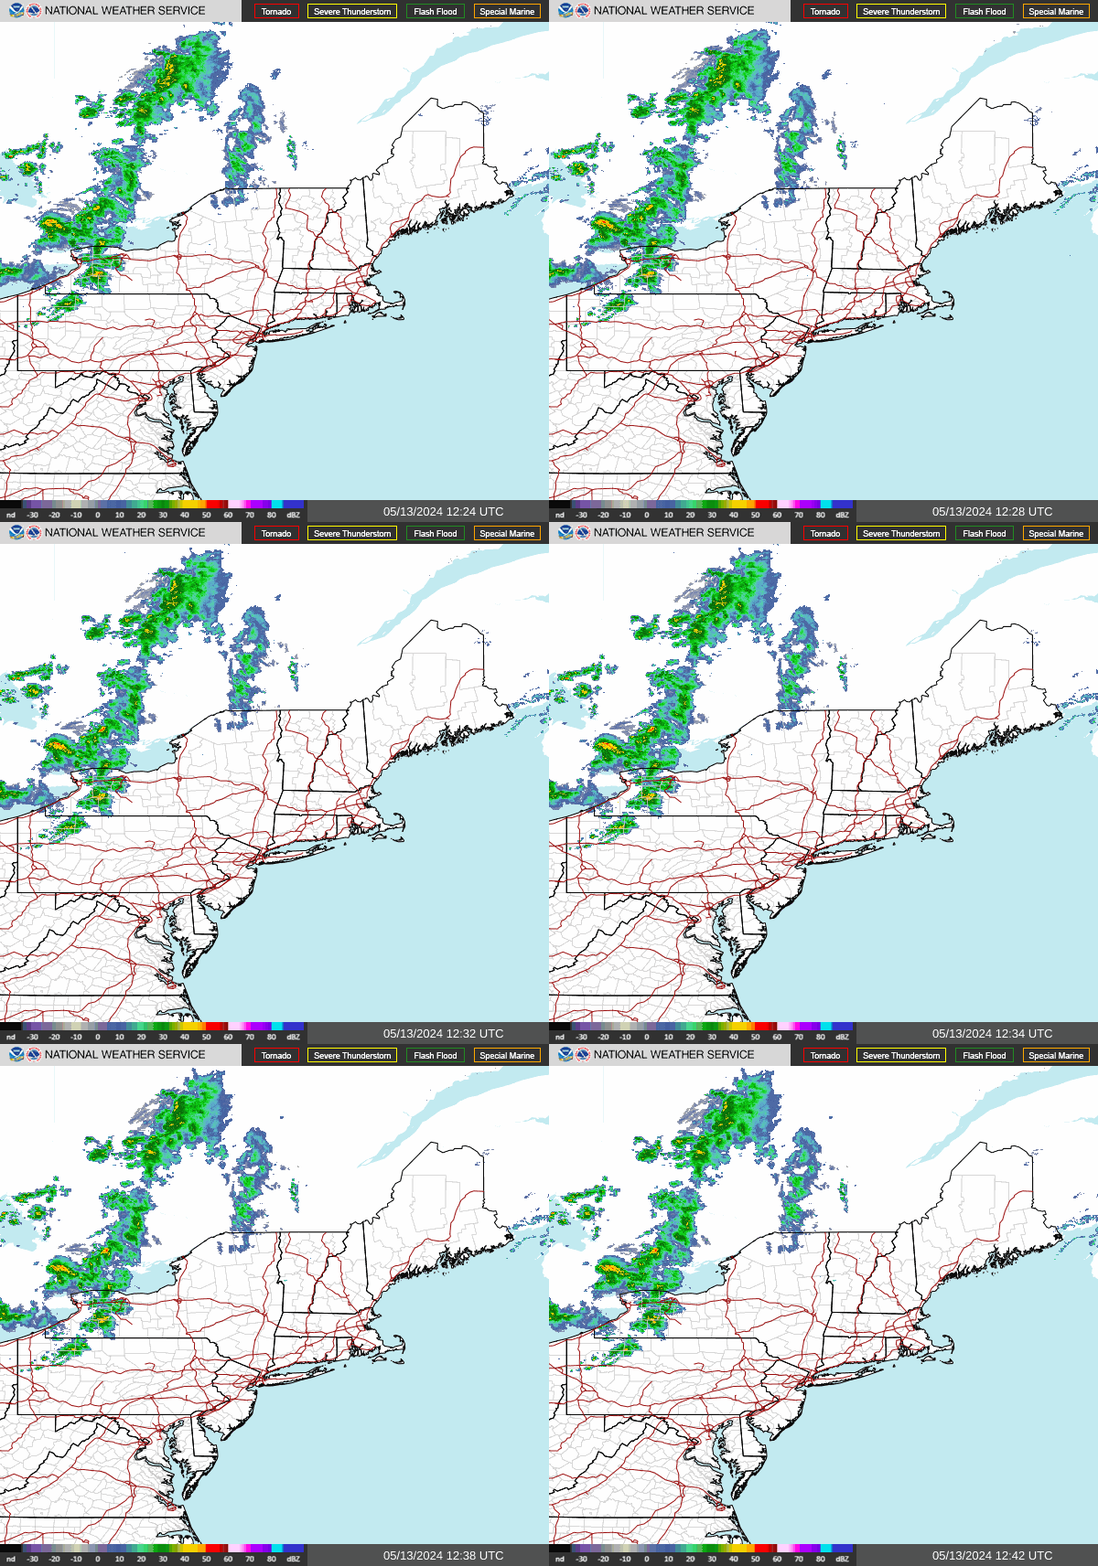
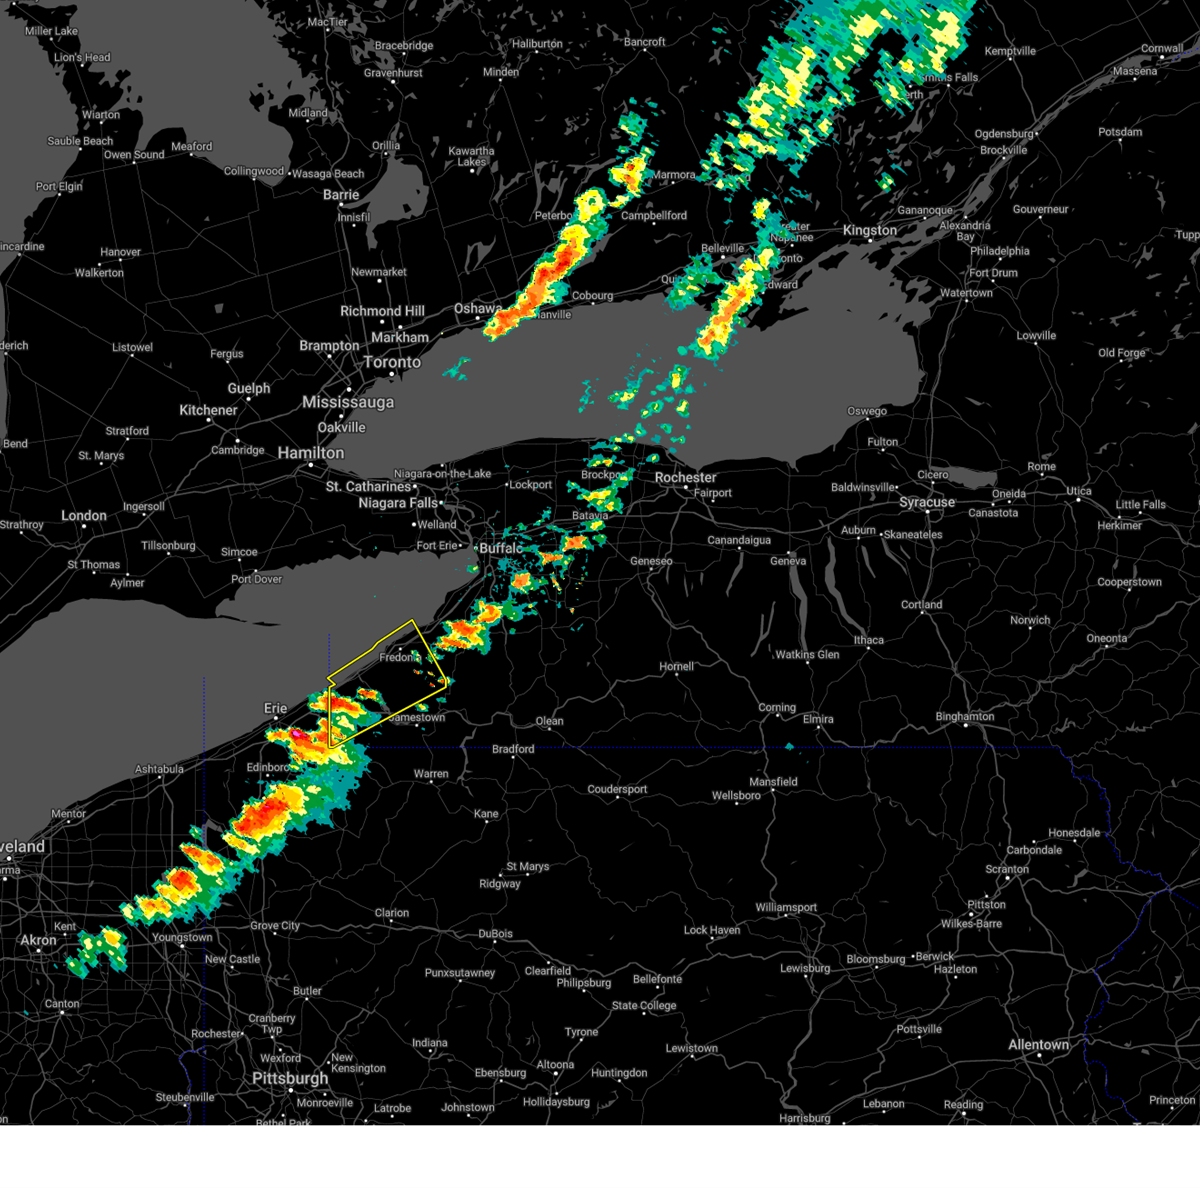
New York Radar Loop: Track Live Weather & Storms
Weather in New York can change in the blink of an eye. Whether you are navigating a sudden summer downpour in Manhattan, tracking a nor'easter heading toward Long Island, or watching lake-effect snow roll into Buffalo, having access to real-time weather data is essential. Checking a New York radar loop is the single best way to see live precipitation, understand storm trajectories, and make informed decisions before heading outdoors.

In this guide, we will explore how weather radar works, where to find the most accurate loops, and how to interpret the data to stay safe during severe weather events.
Understanding the New York Radar Loop
A weather radar loop is a chronological sequence of radar images stitched together into a short animation. Instead of showing just a single snapshot of the sky, a loop reveals motion. This allows you to see:
- The exact direction a storm is moving (its vector).
- Whether a weather system is intensifying or weakening.
- How fast precipitation is traveling toward your specific location.
- When a storm front is expected to arrive and depart.
For a state as geographically diverse as New York, relying on a single radar station is rarely enough. The National Weather Service (NWS) operates multiple NEXRAD (Next-Generation Radar) sites strategically positioned to cover every corner of the state.
Key Radar Sites Covering New York
Depending on where you are located within the Empire State, your local radar data comes from specific Doppler installations:
- New York City / Long Island: Covered primarily by the Upton, NY radar (KOKX), providing crucial details for the tri-state area.
- Capital Region / Hudson Valley: Monitored by the Albany, NY radar (KENX).
- Central New York / Syracuse: Tracked by the Binghamton radar (KBGM) and Montague radar (KTYX).
- Western New York / Buffalo / Rochester: Covered by the Buffalo radar (KBUF).
How to Read Weather Radar Colors

When you pull up a live New York radar loop, you will see a colorful map overlay ranging from light blues and greens to intense reds, purples, and sometimes white. Understanding these color codes helps you gauge the severity of incoming weather.
Precipitation Intensity Guide
- Light Green / Blue: Light rain or drizzle. Visibility might be slightly reduced, but no major travel hazards are typically present.
- Dark Green / Yellow: Moderate rain. Steady precipitation that can lead to wet roads and minor localized pooling.
- Orange / Red: Heavy downpours, strong thunderstorms, or intense snowfall rates. Expect reduced visibility and potential hydroplaning risks on highways.
- Purple / Magenta / White: Extreme weather. This indicates severe thunderstorms, torrential downpours, large hail, or torrential snow rates often associated with embedded squall lines or tornadic activity.
Reflectivity vs. Velocity
Most standard radar loops display Base Reflectivity, which measures the amount of moisture bouncing back to the radar beam. However, advanced users also look at Velocity (Doppler) data. Velocity maps show wind speed and direction relative to the radar station. During severe weather outbreaks in New York, meteorologists use velocity data to spot rotation within thunderstorms long before a tornado touches down.
Tips for Tracking Severe Weather in NY
New York experiences a wide array of high-impact weather throughout the year. To get the most out of your radar tracking, keep these best practices in mind:
- Check the timestamp: Ensure your radar loop is truly live and not showing cached or delayed data. Look for a timestamp indicating when the latest scan occurred.
- Watch the storm motion vector: Don't just look at where the rain is right now. Draw an imaginary line from the storm's current position along its trajectory path to see if it is heading directly toward your zip code.
- Account for terrain: Mountainous regions like the Adirondacks and Catskills can disrupt radar beams or cause localized weather anomalies. Cross-reference radar data with local topography and spotter reports.
- Combine radar with alerts: Radar loops show what is happening in the atmosphere, but official NWS watches and warnings provide the necessary context regarding life-and-death decisions.
Summary
A reliable New York radar loop is an indispensable tool for anyone living in or visiting the state. By learning how to interpret radar colors, understanding regional station coverage, and tracking storm movement, you can stay ahead of changing weather conditions. Bookmark a trusted radar source today so you are never caught unprepared by unexpected rain, snow, or severe storms.