NOAA Radar Dallas Fort Worth: Live Storm Tracking Guide
North Texas sits at the southern corridor of Tornado Alley, where dryline boundaries, cold fronts, and moist Gulf air frequently collide to trigger intense thunderstorms. When squall lines, supercells, or flash-flooding events threaten the Metroplex, consulting the noaa radar dallas fort worth network provides the highest quality, scientifically verified insight into what is happening in the atmosphere. Knowing which radar sites serve the region and how to interpret their data can turn an intimidating screen of colored pixels into actionable, life-saving information.

Inside KFWS: The Primary NOAA Radar in Dallas Fort Worth
The backbone of severe storm surveillance across North and Central Texas is KFWS, the WSR-88D (Weather Surveillance Radar, 1988 Doppler) operated by the National Weather Service (NWS) Weather Forecast Office in Fort Worth. Located near Spinks Airport in Burleson, just south of Fort Worth, KFWS provides comprehensive volume scans covering the entire DFW Metroplex and stretching into surrounding rural counties.
KFWS operates on an S-band frequency (roughly 2.7 to 3.0 GHz). S-band signals utilize an 8-to-10 centimeter wavelength, which offers minimal signal attenuation. This means the radar beam can punch through heavy cores of torrential rain and severe hail without losing its ability to detect what lies on the other side. KFWS rotates through multiple elevation angles in volume coverage patterns (VCPs), scanning near the surface and several miles aloft every four to six minutes during severe weather events.
The Metroplex Advantage: TDWR Radar Coverage
While KFWS is the primary workhorse, North Texas is one of the few metropolitan areas in the world with multiple high-resolution aviation radar sites that feed into public NOAA displays. The Federal Aviation Administration (FAA) operates two Terminal Doppler Weather Radars (TDWR) in the area:
- TDFW: Located northeast of Dallas/Fort Worth International Airport.
- TDAL: Located near Dallas Love Field.
TDWR sites operate on the C-band (around 5 GHz). Because C-band waves have shorter wavelengths, they produce much higher spatial resolution at close range than standard WSR-88D stations. However, they suffer from attenuation in heavy rainfall. Meteorologists and storm spotters often cross-reference KFWS with TDFW and TDAL because the airport radars excel at detecting low-level wind shear, microbursts, and shallow rotation couplets that standard radar might overshoot.
How to Read NOAA Radar Products During Severe Weather
Modern NOAA radar products go far beyond simple green-and-red rain maps. To extract real value during severe weather, focus on three primary data streams: reflectivity, velocity, and dual-polarization products.
1. Base Reflectivity vs. Composite Reflectivity
Reflectivity measures how much energy from the radar pulse bounces back to the dish, expressed in decibels of reflectivity (dBZ):
Video: 🔴LIVE: North Texas weather radar
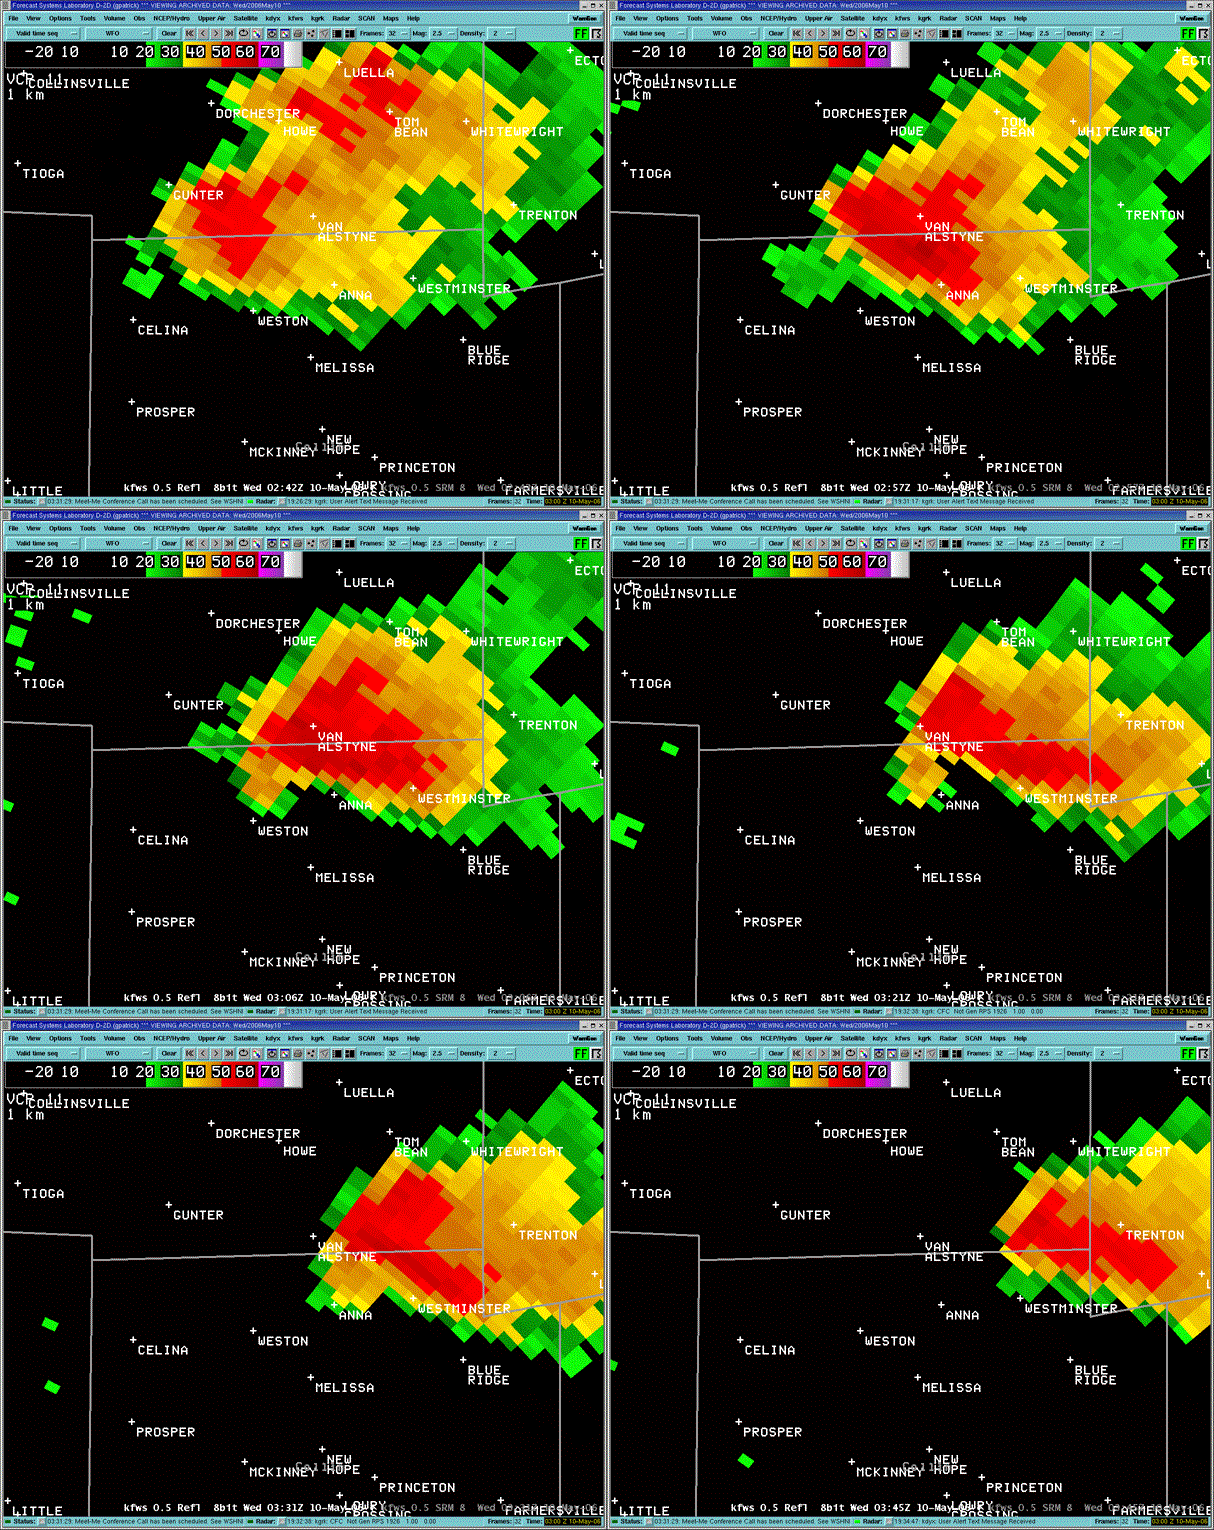
- Base Reflectivity (0.5° Tilt): Shows precipitation closest to the ground. This is the product to watch for current ground-level hazards, hook echoes, and boundary collisions (gust fronts).
- Composite Reflectivity: Displays the highest reflectivity value found across all scanned tilts in a vertical column. If composite reflectivity shows intense values (60+ dBZ) while base reflectivity appears modest, a storm may be holding a massive core of hail aloft that could collapse at any moment.
2. Base Velocity and Storm-Relative Motion
Doppler velocity evaluates the motion of precipitation particles along the radar beam's line of sight:
- Red: Precipitation moving away from the radar site.
- Green: Precipitation moving toward the radar site.
When bright green and bright red pixels appear directly adjacent to one another, meteorologists call this a velocity couplet. In North Texas supercells, a tight velocity couplet indicates mesocyclonic rotation—the precursor to a tornado. If you are tracking a storm moving across Tarrant or Dallas County, using Storm-Relative Motion (SRM) strips out the storm's overall travel speed to reveal rotation that would otherwise be masked by fast forward movement.
3. Dual-Polarization: Identifying Tornado Debris
In 2012, KFWS was upgraded with dual-polarization technology, sending out pulses oriented both horizontally and vertically. This provides insight into the size, shape, and uniformity of airborne targets:
- Correlation Coefficient (CC): Measures how uniform the targets are. Raindrops and hailstones produce a high CC (near 0.98 to 1.0). Irregular objects like insulation, wood, and metal produce a low CC (often below 0.80). When a tight velocity couplet coincides with a localized drop in CC directly within the storm core, it marks a Tornado Debris Signature (TDS), confirming a tornado is actively on the ground lofting debris.
- Differential Reflectivity (ZDR): Compares horizontal versus vertical dimensions. Oblate raindrops yield positive ZDR values, while tumbling, spherical hailstones produce values close to zero, pinpointing hail cores within rain-wrapped storms.
Radar Limitations in the Dallas–Fort Worth Metroplex
No radar system is flawless. Understanding the limitations of KFWS and surrounding sensors ensures you do not draw inaccurate conclusions during severe weather:
- Radar Beam Height and Earth Curvature: Radar beams travel in straight lines, but the Earth curves beneath them. Near the antenna in Burleson, the 0.5° tilt observes weather just a few hundred feet off the ground. By the time that same beam reaches McKinney, Denton, or Sherman, it is thousands of feet up, scanning well above the ground level where tornadoes and damaging winds actually touch down.
- Cone of Silence: The WSR-88D dish cannot tilt straight up (its highest elevation is usually 19.5°). Directly above the KFWS site in Burleson, a small cone exists where no storm data can be recorded.
- Ground Clutter and Non-Precipitation Returns: During calm evenings, warm-season inversions can bend the radar beam back toward the ground (anomalous propagation), lighting up the screen with fake rain over downtown Dallas or Fort Worth. Similarly, flocks of migrating birds, swarms of insects, and smoke from controlled burns regularly show up on high-sensitivity clear-air mode scans.
Where to Access Live DFW NOAA Radar Feeds
To view official NOAA data without commercial delays or aggressive filtering, several platforms provide direct access:
- NWS Enhanced Radar (radar.weather.gov): The official NOAA web interface. It delivers interactive GIS overlays, warnings, dual-pol products, and seamless switching between KFWS, TDFW, and TDAL.
- Specialized Doppler Applications: Software such as RadarScope and RadarOmega ingest raw Level 2 and Level 3 data straight from the NOAA Open Radar Data server. These applications avoid the smoothing filters found on common television and lifestyle apps, giving you unedited, pixel-by-pixel reflectivity and velocity scans.
- NWS Fort Worth Social Feeds: The operational meteorologists at NWS Fort Worth regularly post annotated radar captures during active warnings, highlighting specific rotational trends, hail cores, and estimated arrival times for Metroplex communities.
Staying Weather-Ready Across North Texas
While monitoring NOAA radar is a great situational awareness habit, never rely on a radar app alone as your warning system. Fast-moving squall lines can surge forward in minutes, and mobile data networks can slow down during widespread power outages. Pair your radar tracking with a dedicated NOAA Weather Radio, local storm warning alerts, and a clear understanding of your household's safe shelter plan before storms fire along the dryline.