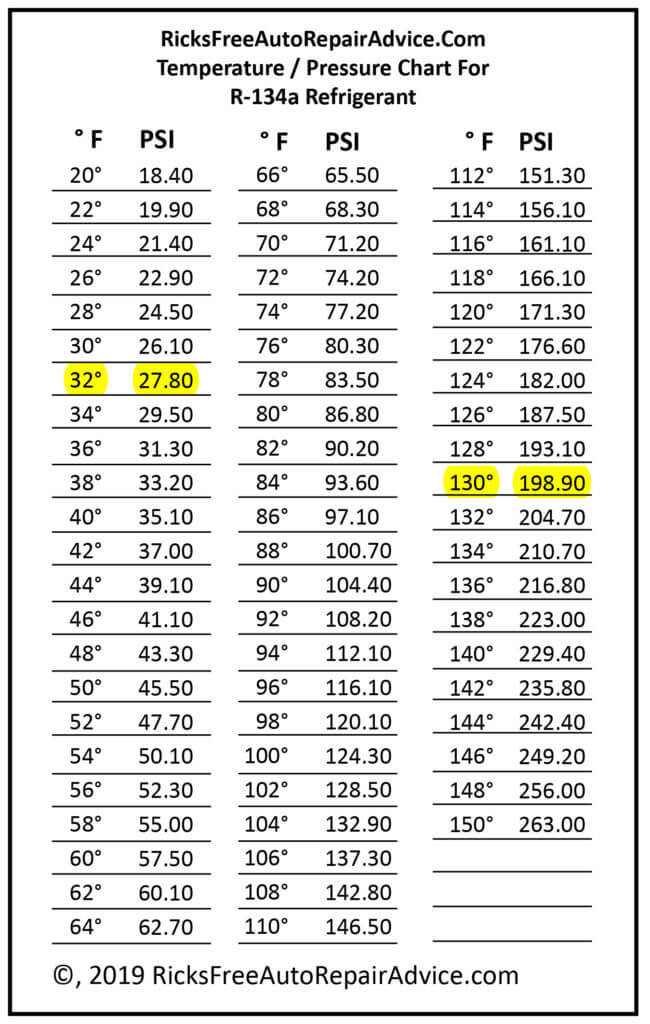
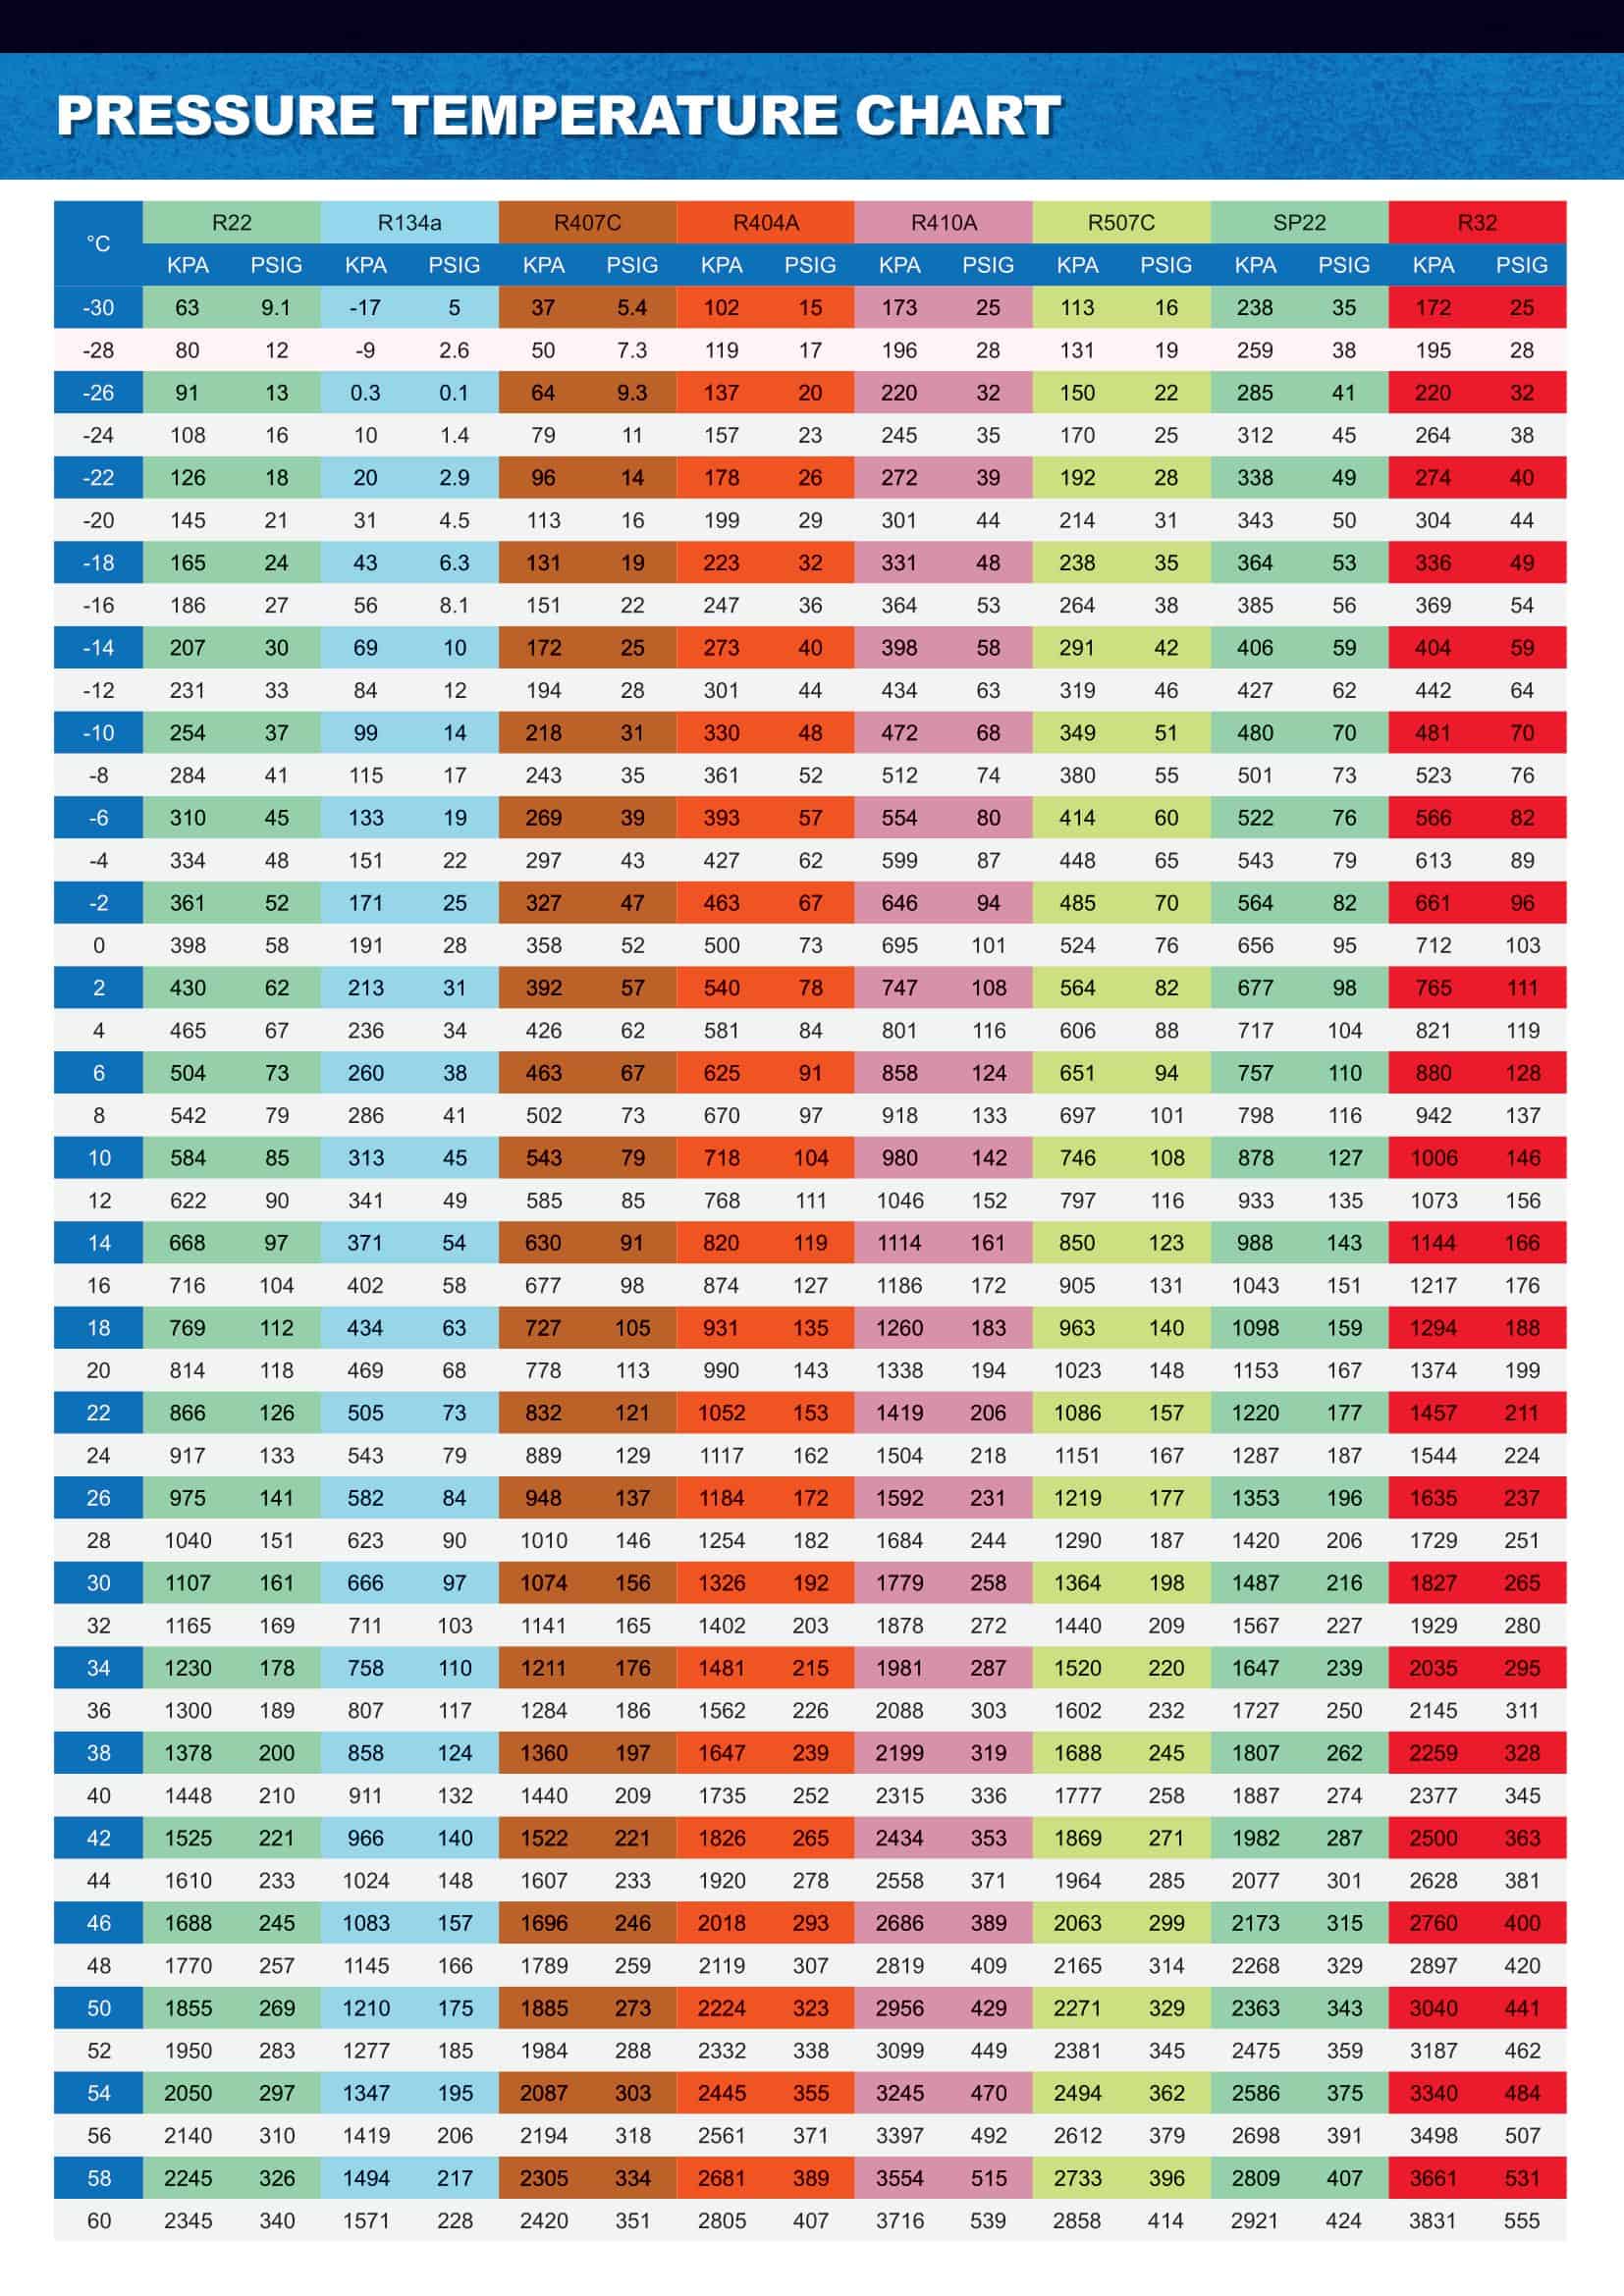
R-134a Pressure Chart: AC Diagnostic Guide
When an automotive air conditioning system stops blowing ice-cold air, guesswork usually leads to overcharged systems, damaged compressors, or wasted money on canned refrigerant. Diagnosing an AC system accurately requires measuring real-time operating pressures with a manifold gauge set and comparing those numbers to expected baseline conditions. Consulting an r-134a pressure chart is the most reliable way to determine whether a vehicle's climate control system is running within factory parameters or suffering from a mechanical fault.

Refrigerant pressure is not a static number; it fluctuates directly with the surrounding ambient air temperature. A low-side reading of 30 PSI might indicate a perfectly balanced charge on a crisp 65°F morning, but on a 95°F afternoon, that exact same reading could signal a severe undercharge. Understanding how temperature dictates operating pressure is critical for any successful AC diagnosis.
R-134a Pressure Chart: Temperature vs. PSI Reference
The following chart outlines normal operating pressures for an automotive R-134a system at various ambient temperatures. These values assume the engine is running at operating temperature, the cabin blower is on high, doors or windows are open to keep a heat load on the evaporator, and the engine speed is held between 1,500 and 2,000 RPM.
| Ambient Temp (°F / °C) | Low-Side Pressure (PSI) | High-Side Pressure (PSI) |
|---|---|---|
| 65°F (18°C) | 25 – 35 PSI | 135 – 155 PSI |
| 70°F (21°C) | 35 – 40 PSI | 145 – 160 PSI |
| 75°F (24°C) | 35 – 45 PSI | 150 – 170 PSI |
| 80°F (27°C) | 40 – 50 PSI | 175 – 210 PSI |
| 85°F (29°C) | 45 – 55 PSI | 225 – 250 PSI |
| 90°F (32°C) | 45 – 55 PSI | 250 – 270 PSI |
| 95°F (35°C) | 50 – 55 PSI | 275 – 300 PSI |
| 100°F (38°C) | 50 – 55 PSI | 315 – 325 PSI |
| 105°F (41°C) | 50 – 55 PSI | 330 – 335 PSI |
| 110°F (43°C) | 50 – 55 PSI | 340 – 345 PSI |
Note: Individual vehicle specifications can vary slightly depending on whether the system uses a thermal expansion valve (TXV) or a fixed orifice tube. Always cross-reference the under-hood emission/AC decal for vehicle-specific tolerances.
How to Take Accurate Pressure Measurements
Connecting a manifold gauge set improperly will give misleading readings. Follow this standardized procedure to get stable, diagnostic-grade data:
- Inspect before connecting: Ensure the vehicle engine is off. Check the condition of the drive belt, look for visible oil traces indicating refrigerant leaks, and make sure the condenser fins in front of the radiator are free of debris.
- Attach the manifold couplers: Connect the blue low-side quick-coupler to the low-pressure service port (larger suction line) and the red high-side coupler to the high-pressure port (smaller liquid line). Ensure the coupler collars click fully into place.
- Establish testing conditions: Start the engine and bring it to normal operating temperature. Roll the vehicle's front windows all the way down. Set the AC to "MAX" or "Recirculate," select the lowest temperature setting, and turn the cabin blower fan to its highest speed.
- Elevate engine speed: Automotive compressors do not operate at peak efficiency at curb idle. Hold the engine speed steady between 1,500 and 2,000 RPM.
- Allow the system to stabilize: Let the AC run under these conditions for 5 to 10 minutes. Watch both needle gauges until they settle before comparing the numbers to the chart.
Diagnosing Common AC Problems Using Gauge Readings
A dual-gauge manifold provides two distinct data points. Evaluating how the high side and low side interact is what points you toward the root cause of the failure.
1. Low Side Is Low; High Side Is Low
When both the suction and discharge pressures fall significantly below chart specifications, the system is almost certainly low on refrigerant due to a leak. A low-side reading dropping into vacuum or near zero PSI combined with a high side that struggles to reach 100 PSI means the compressor has insufficient mass of refrigerant to pump. Inspect service valve cores, O-rings, condenser tubes, and the compressor shaft seal with a UV dye light or electronic sniffer.

2. Low Side Is High; High Side Is High
If both needles sit well above normal ranges, two distinct issues typically cause the problem:
- Overcharged system: An excessive amount of refrigerant fills the condenser, reducing the space available for gaseous refrigerant to condense into liquid. This drives hydraulic pressures upward on both sides.
- Poor condenser heat dissipation: If the electric cooling fans are non-functional, the fan clutch is slipping, or the condenser is packed with dirt, heat cannot leave the refrigerant. Without cooling, pressure spikes rapidly across the high and low loops.
3. Low Side Is High; High Side Is Low
When the high-pressure side cannot build adequate pressure while the low side remains elevated (often reading 60 to 80 PSI), the system cannot generate a pressure differential. This condition indicates an internal failure inside the compressor. Broken reed valves, worn piston rings, or an open internal pressure relief bypass prevent the compressor from pumping effectively. Replacing the compressor, flushing the lines, and installing a new receiver-drier/accumulator is the required remedy.
4. Low Side Is Low (or in Vacuum); High Side Is Normal to Very High
A severe divergence where the suction line is pulled into a deep vacuum while the high side reads normal or exceptionally high points to a hydraulic restriction. The most common culprit is a clogged orifice tube screen, a failed-shut thermal expansion valve (TXV), or moisture freezing inside the valve orifice. The compressor pulls all available refrigerant out of the evaporator, but the restriction blocks liquid from returning to complete the circuit.
Critical Factors That Shift Normal Pressures
While an R-134a pressure chart provides standard baselines, field conditions can introduce variations that you must account for during your analysis:
- Relative Humidity: High ambient humidity puts a massive thermal load on the evaporator core as water vapor condenses onto the fins. On muggy days, expect your low-side pressures to run at the higher end of the chart's range.
- Engine Bay Heat Soak: Sitting stationary on asphalt can raise the local temperature in front of the condenser by 15°F to 20°F above official weather reports. Measure ambient air temperature directly in front of the vehicle's bumper, not by checking your phone's weather app.
- Variable Displacement Compressors: Modern vehicles frequently use clutchless, variable-displacement compressors controlled by internal pulse-width modulated (PWM) control valves. These systems modulate displacement dynamically, meaning low-side pressures often hover between 28 and 35 PSI continuously, regardless of engine RPM changes.
The Golden Rule of Recharging
A pressure chart is an indispensable diagnostic baseline, but it is not a substitute for charging an AC system by weight. Automotive manufacturers tune their refrigerant loops down to the precise ounce or gram. Ambient humidity, airflow across the condenser, and vehicle ducting can cause pressures to fluctuate by 10 to 15 percent even when the system holds the correct charge.
If you determine that an AC system is low, the professional standard is to recover the remaining refrigerant using an EPA-certified recovery machine, pull a deep vacuum (29.9 inHg) to boil off moisture, verify that the system holds vacuum without leaking, and recharge the exact weight specified on the under-hood manufacturer label using an accurate digital scale.