The Flat Earth Map Explained: History and Science
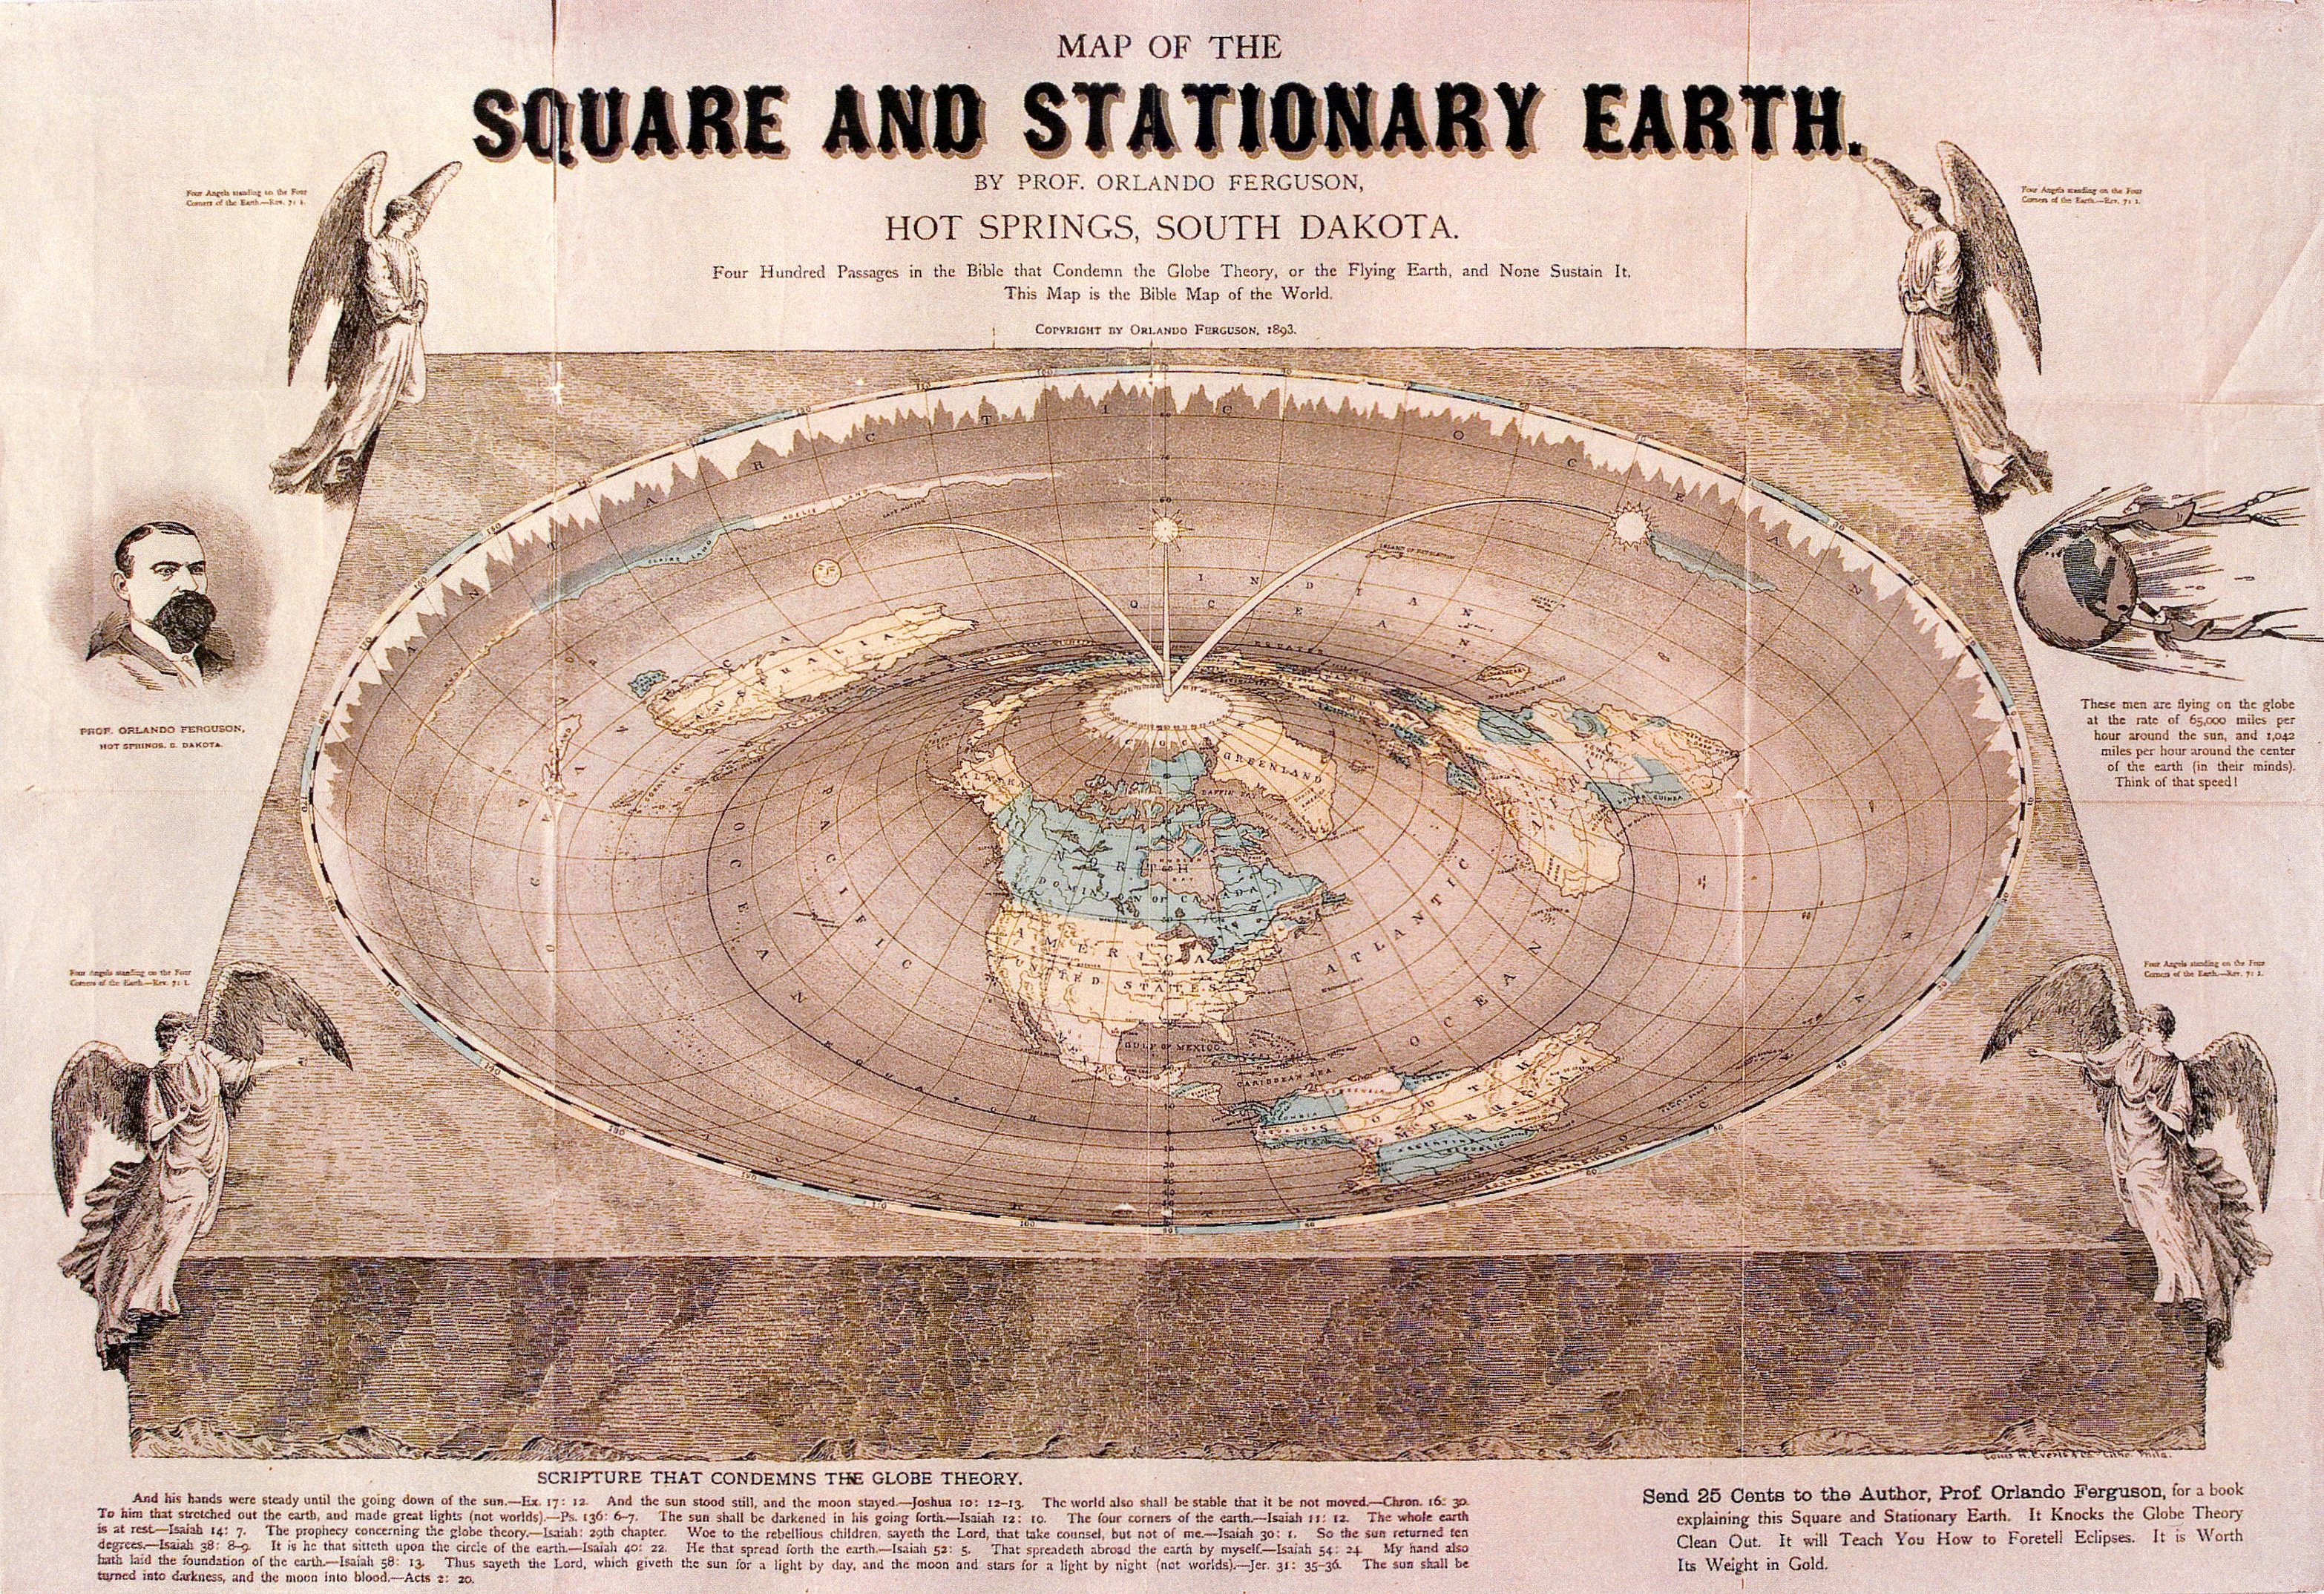
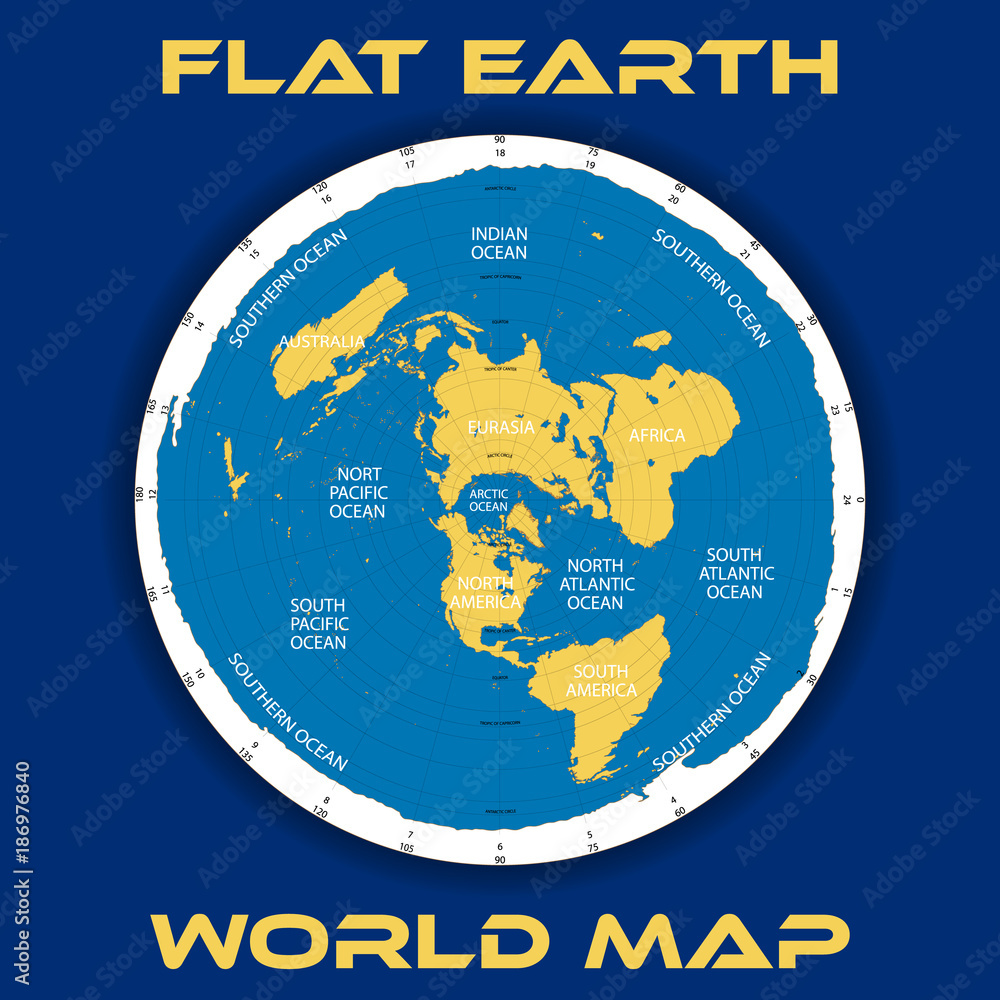
When people refer to the modern flat earth map, they are almost universally picturing a specific circular graphic: a disk with the Arctic Circle at the center, the continents splayed outward, and a towering wall of Antarctic ice ringing the entire perimeter. To modern cartographers, this diagram is known as a polar azimuthal equidistant projection. To proponents of alternative cosmological models, it represents an alleged literal layout of the terrestrial plane.
Understanding this visual requires separating historical cartography from modern internet folklore. How did a legitimate 19th-century mapping projection become the standard blueprint for flat Earth theories, and what happens when that layout is tested against real-world navigation?
The Origins: Alexander Gleason and the 1892 Patent
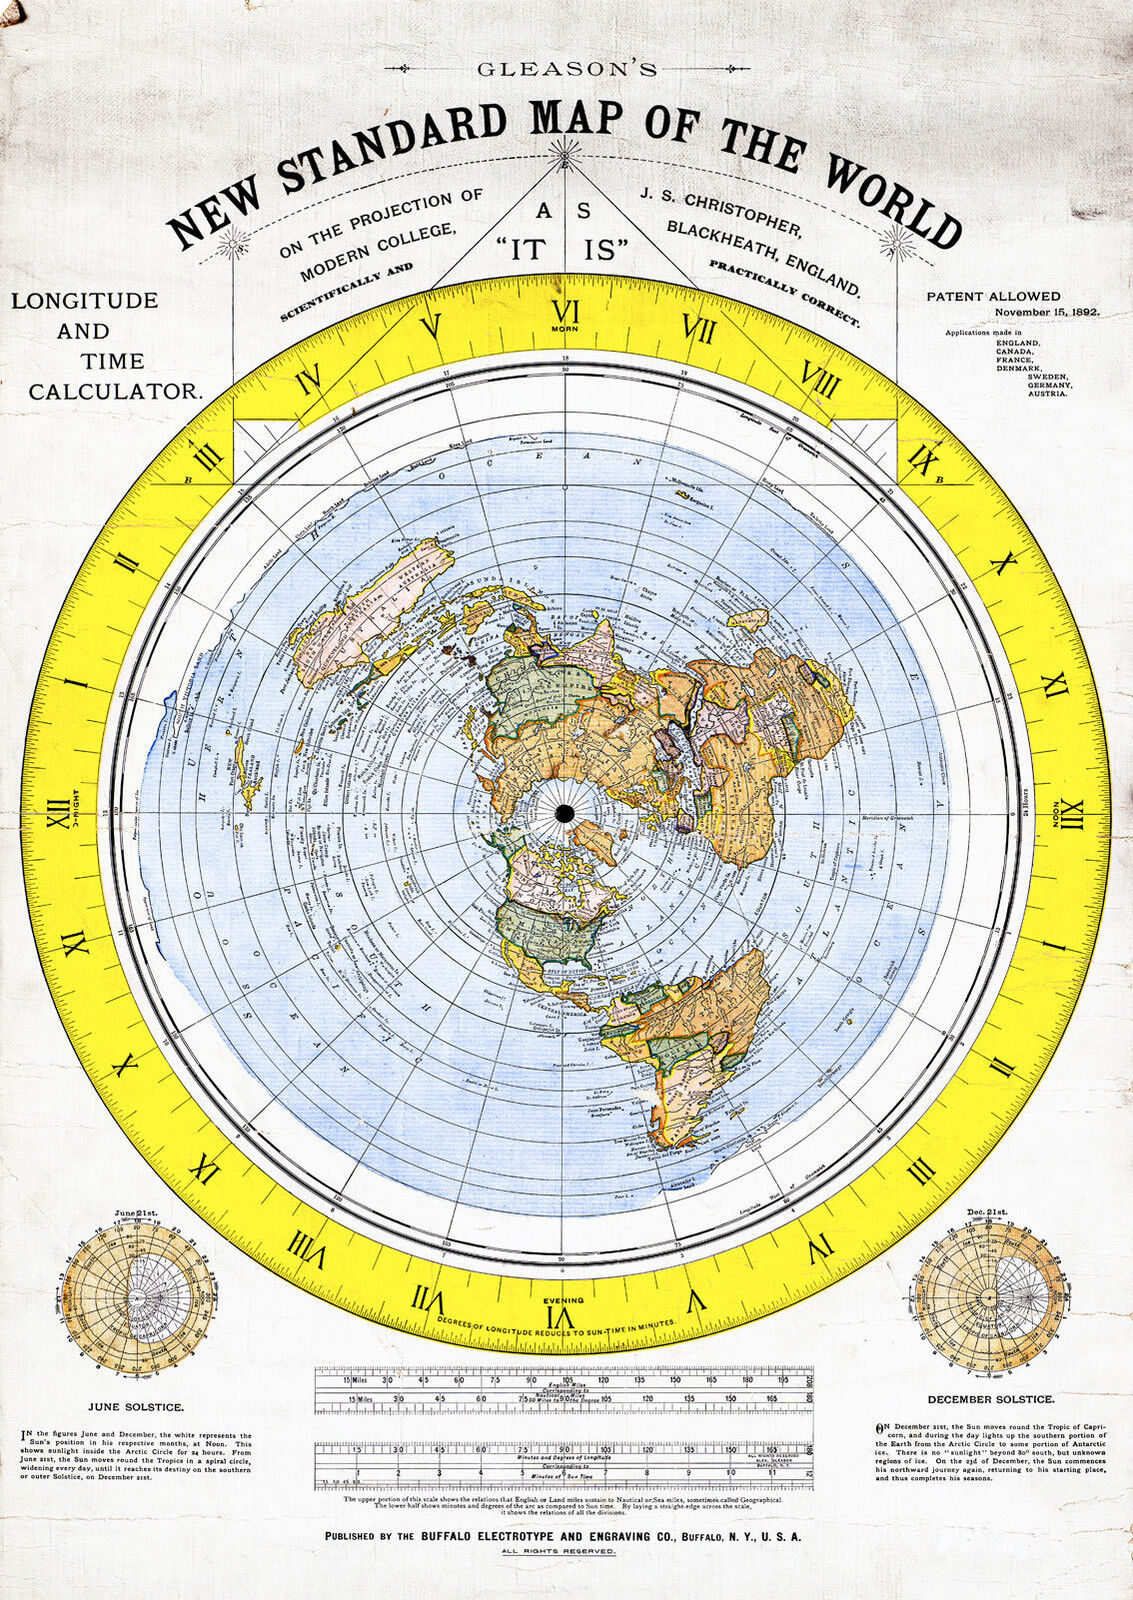
The visual framework used by modern flat Earth communities traces back to an 1892 civil engineer named Alexander Gleason. Gleason published a large, intricate chart titled the "New Standard Map of the World: On the Projection of Modern College, Blackheath, England; Scientifically and Practically Correct."
Gleason was an adherent of "Zetetic Astronomy," a 19th-century movement started by Samuel Rowbotham that rejected Newtonian physics and mainstream astronomy in favor of sensory-based literalism. Gleason patented his map (U.S. Patent No. 497,917) not necessarily as an astronomical revelation, but as an educational and calculating device designed to easily compute longitude and time differences across the globe.
On his patent application, Gleason noted that his diagram could calculate time differences between locations faster than a traditional globe. However, flat Earth advocates quickly adopted the chart as literal cartographic proof that the Earth is a flat plane encircled by an outer boundary of ice.
Understanding the Gleason Flat Earth Map Design
To grasp why this particular layout became so widespread, it helps to examine its structural elements:
- The North Pole at the Center: The geographic North Pole serves as the central hub of the circle. Longitude lines radiate outward from this center point like spokes on a bicycle wheel.
- The Northern Continents: North America, Europe, and Asia sit relatively close to the center. Because the projection originates from the Arctic, these landmasses retain proportions that look familiar to anyone who has viewed a standard school globe.
- The Southern Ocean and Antarctica: Instead of appearing as an isolated continent at the bottom of a globe, Antarctica is stretched across the entire outer circumference of the circle, forming a perimeter barrier roughly 60,000 miles long in their calculations.
- The Celestial Motion: In this model, the Sun and Moon do not rise and set through planetary rotation. Instead, they are conceived as small, localized luminaries—roughly 32 miles across and suspended a few thousand miles above the surface—moving in concentric circles between the Tropics of Cancer and Capricorn.
The Geometry of Map Projections: Why 2D Maps Distort
The central misunderstanding surrounding the flat Earth map stems from the mathematical impossibility of flattening a sphere without distortion—a reality formalized by mathematician Carl Friedrich Gauss in his Theorema Egregium.
Every two-dimensional world map is a projection. When cartographers transfer coordinates from an oblate spheroid onto a flat sheet of paper, they must choose which property to preserve and which to sacrifice:
- Shape (Conformality): Preserved in Mercator projections, which causes landmasses near the poles to appear massive.
- Area (Equivalence): Preserved in Gall-Peters projections, which distorts shapes into stretched silhouettes.
- Distance (Equidistance): Preserved along specific lines in equidistant projections.
Gleason’s diagram is an azimuthal equidistant projection centered on the North Pole. In this projection, distances measured straight outward along radial lines from the North Pole are mathematically accurate. However, distances running horizontally (east to west) become progressively stretched the farther you travel from the center point.
By the time the projection reaches the Southern Hemisphere, east-west landmasses are distorted to several times their actual scale. Australia, South America, and southern Africa are stretched horizontally across the outer edges of the circle.
Real-World Navigational Tests
Cartography is not merely a theoretical exercise; it governs real-world logistics, maritime trade, and international aviation. When the Gleason layout is treated as a 1:1 physical blueprint rather than a mathematical projection, it encounters insurmountable physical contradictions.
Video: Flat earth map
1. Southern Hemisphere Flight Routes
On an azimuthal projection centered on the North Pole, the distance between any two southern landmasses is immense because the map fans out at the perimeter. For instance, a direct flight from Santiago, Chile, to Sydney, Australia, would require an aircraft to fly diagonally across Central America, North America, the North Pacific, and down through East Asia—a path exceeding 15,000 miles.
In reality, commercial airlines operate direct trans-polar routes across the Southern Ocean between Santiago and Sydney, as well as Johannesburg to Perth. These flights take approximately 12 to 14 hours and cover around 7,000 miles. These commercial schedules would be aerodynamically impossible if the aircraft had to cross the distances implied by a disk map.
2. The Apparent Size of Antarctica
In the flat Earth model, Antarctica is an enormous ice ring surrounding the inhabited world, which would give it a coastline well over 50,000 miles long. In physical reality, researchers, solo explorers, and international scientific teams have repeatedly circumnavigated and crossed Antarctica.
Vessels competing in the Vendée Globe yacht race routinely sail around Antarctica in roughly 70 to 80 days across a path of roughly 14,000 to 16,000 nautical miles—a distance consistent with an island continent located at the base of a sphere, not an outer boundary spanning the entire circumference of the Earth.
3. The Double Celestial Poles
Navigators have relied on the night sky for millennia. In the Northern Hemisphere, stars appear to rotate counterclockwise around Polaris (the North Star). In the Southern Hemisphere, stars rotate clockwise around the Southern Celestial Pole, near the Southern Cross constellation.
On a single flat disk with the North Pole at its center, it is geometrically impossible for observers in South Africa, Australia, and South America to all face south—looking in opposite outward directions away from the center—and simultaneously view the exact same southern constellations rotating around a single southern celestial pivot point.
Ancient Cosmologies vs. Modern Flat Earth Maps
Popular internet narratives often claim that ancient civilizations all operated with a flat earth map. While early Bronze Age civilizations in Mesopotamia, Egypt, and ancient China described various dome-and-disk cosmologies, mathematical cartography quickly moved away from these views.
By the 6th century BCE, Greek philosophers like Pythagoras and Parmenides concluded the Earth was spherical based on observations of lunar eclipses (which consistently cast a circular shadow) and the changing positions of stars as travelers moved north and south. Around 240 BCE, Eratosthenes calculated the circumference of the Earth with remarkable accuracy using shadows cast in Alexandria and Syene.
By the 2nd century CE, Claudius Ptolemy published his Geographia, complete with spherical coordinate systems of latitude and longitude that modern cartography still builds upon today. The medieval myth that Columbus set out to prove the Earth was round is historically inaccurate; Columbus and his contemporaries knew the Earth was round, but argued over its precise circumference.
Why Gleason's Map Still Resonates
The modern persistence of the Gleason map does not stem from cartographic utility, but from visual intuition. It looks self-contained, logical at a glance, and fits neatly into the narrative of a protected, centered world. For educational and computational purposes in 1892, it was a clever representation of polar coordinates.
However, when evaluated against the physical demands of global shipping networks, satellite telecommunications, intercontinental flight routes, and celestial mechanics, the flat earth map functions only as what it was originally patented to be: an interesting mathematical projection of a round planet onto a flat sheet of paper.