The Science Behind Silver Price Charts: What You Need to Know
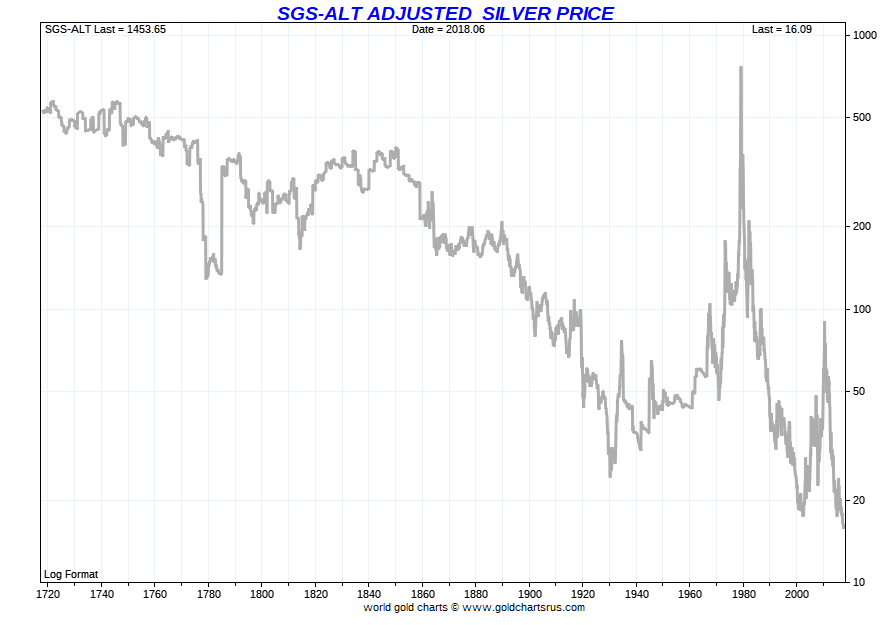
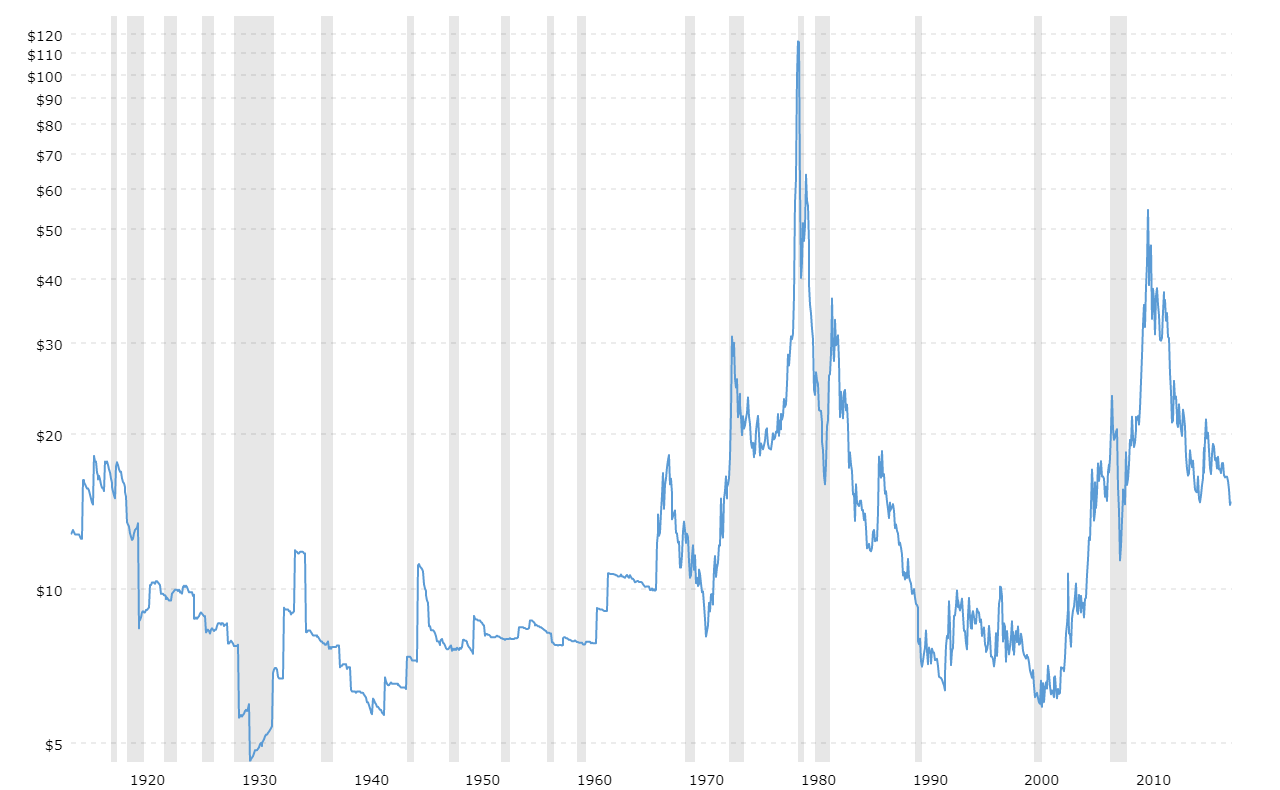
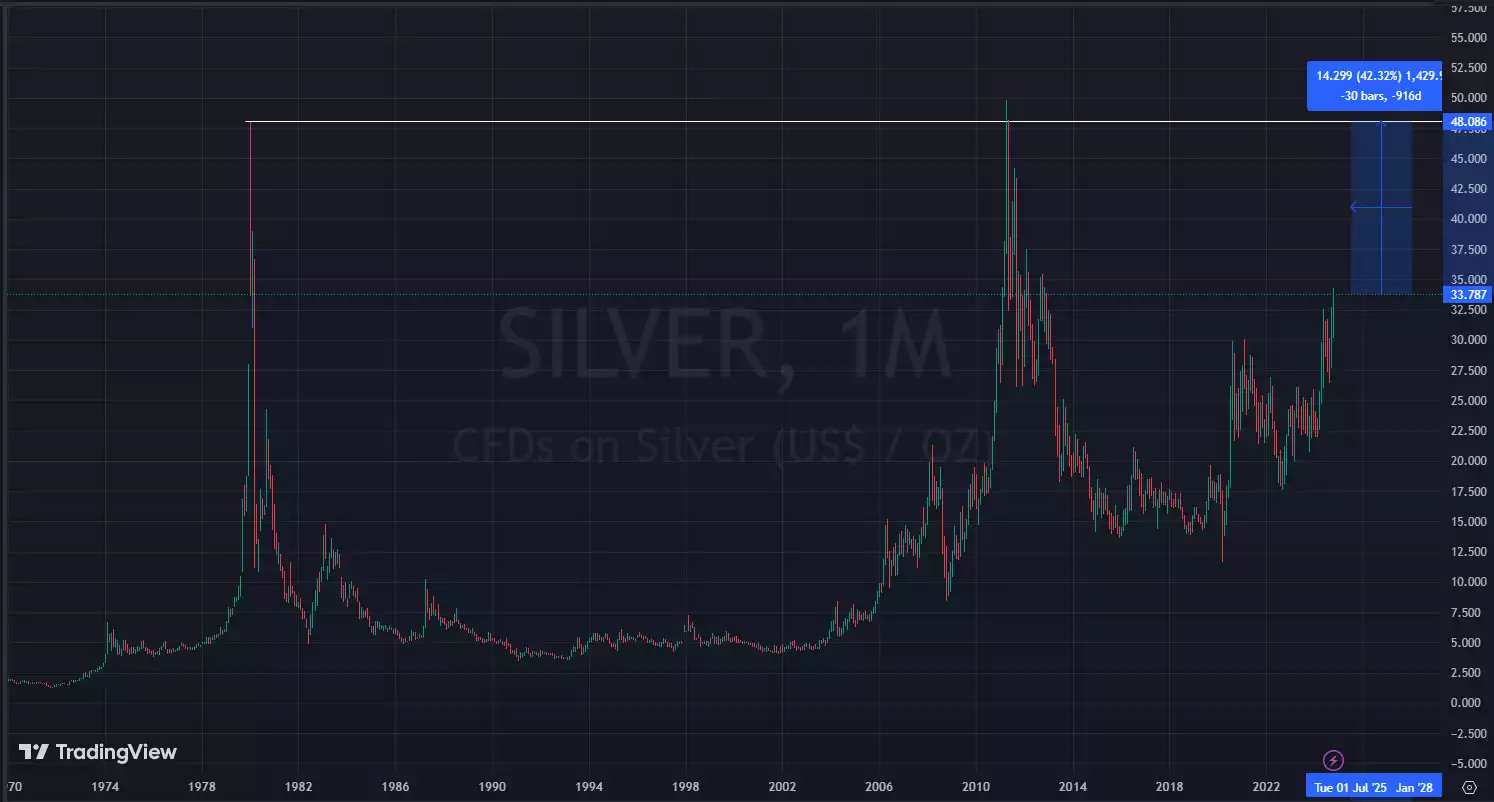
To the untrained eye, a silver price chart looks like an unpredictable roller coaster. Spikes occur without immediate news, multi-month consolidations resolve in violent breakouts, and intraday drops can wipe out weeks of steady gains in minutes. However, these movements are not random. The science behind silver price charts: what you need to know begins with understanding that technical charts are visual records of physics-like financial forces—liquidity depth, order-flow mechanics, industrial supply elasticity, and quantitative market psychology.
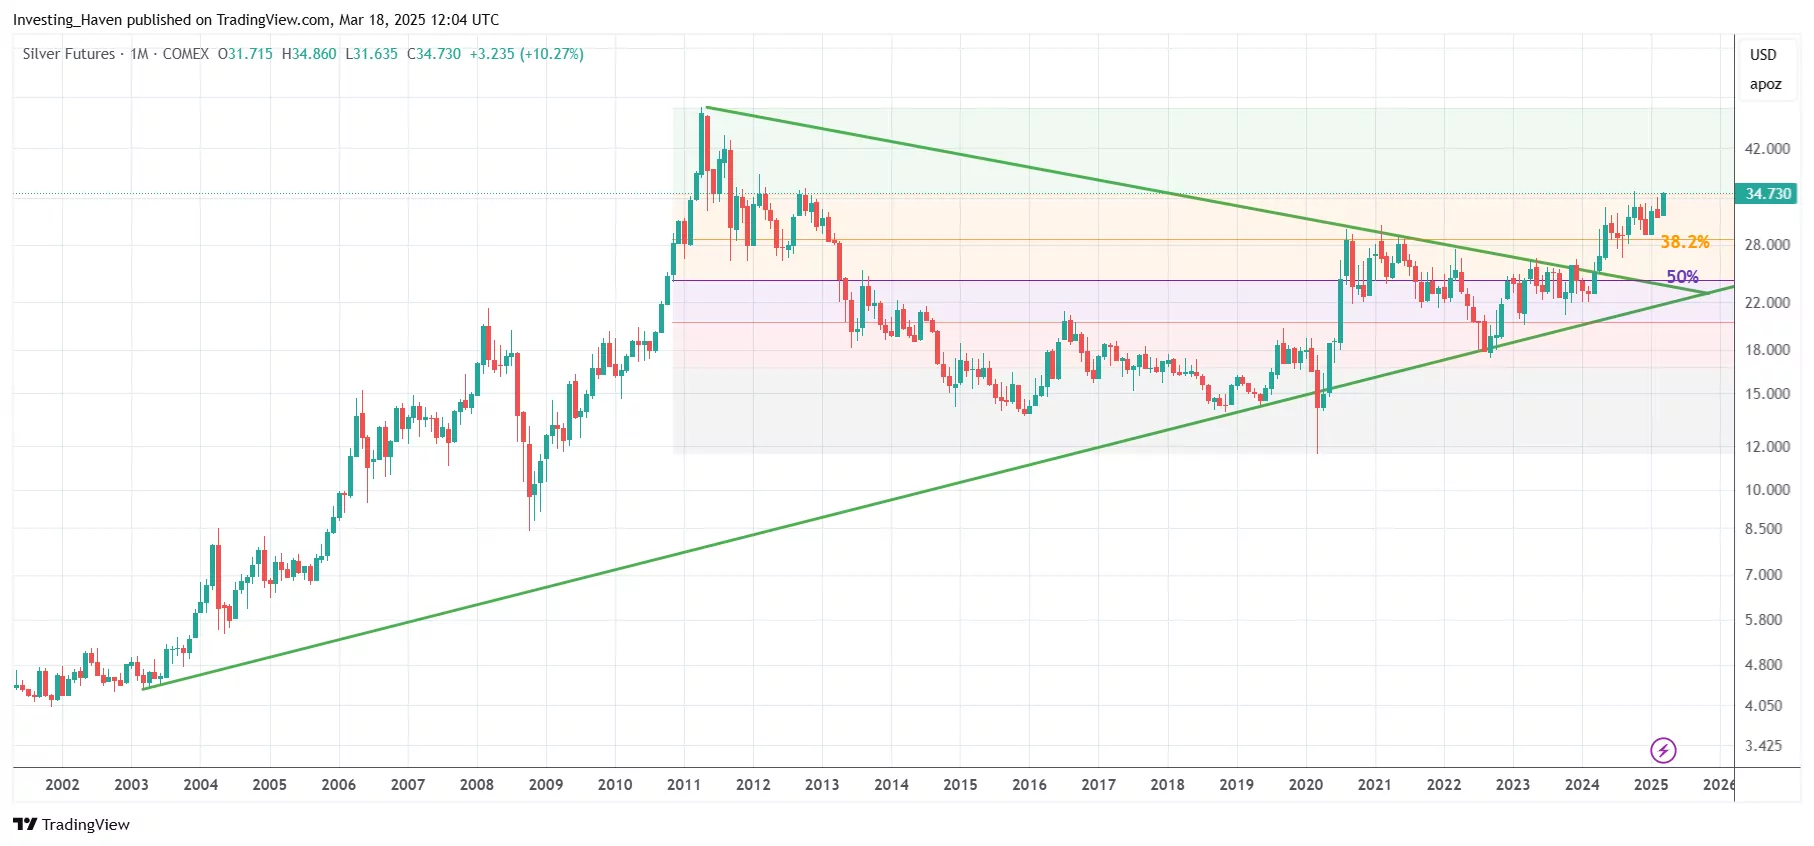
By dissecting the economic and mathematical principles behind these price patterns, investors and traders can transition from reactive speculation to systematic analysis.
The Dual Identity: Industrial Commodity vs. Monetary Asset
The foundational reason silver charts behave differently from gold or crude oil lies in silver's hybrid economic identity. Silver simultaneously acts as a high-technology industrial metal and a sovereign monetary hedge.
- Industrial Base Demand (~55-60% of total demand): Silver has the highest electrical conductivity, thermal conductivity, and optical reflectivity of any known metal. It is indispensable in photovoltaic (solar) panels, automotive electronics, brazing alloys, and medical devices. This demand is relatively price-inelastic in the short term because manufacturers require microscopic amounts per unit, meaning they will buy regardless of temporary price surges.
- Investment and Monetary Demand (~40-45% of total demand): When inflation accelerates, real yields turn negative, or currency debasement looms, capital flows into physical silver, silver exchange-traded funds (ETFs), and COMEX futures as a store of value.
When you observe a silver chart breaking out of a long-term range, it rarely reflects just one of these drivers. The most powerful, sustained trends occur when expanding industrial consumption collides with monetary flight to safe-haven assets.
Market Microstructure: How Price Discovers Itself on the Tape
Every candlestick on a silver chart is generated by transactions occurring predominantly across two venues: the London Bullion Market Association (LBMA) over-the-counter (OTC) physical market and the Chicago Mercantile Exchange (COMEX) futures market.
The Mechanics of the Order Book
Price does not move merely because "there are more buyers than sellers." A trade only executes when a buyer and seller agree on a price. Movement across the chart occurs when aggressive market orders sweep through passive limit orders sitting in the order book.
Because the physical silver market is smaller and less liquid than the gold or crude oil markets, the order book tends to be thinner. When an institutional fund or algorithmic model executes a large block order, it rapidly exhausts the available limit orders at nearby price levels, creating sharp, vertical candles with long shadows (wicks) on the chart.
Paper Leverage vs. Physical Settlement
The COMEX trades hundreds of millions of ounces of "paper silver" daily, representing a multiple of the actual physical metal available in registered depositories. This leverage amplifies chart volatility. When futures contracts approach expiration, traders roll their positions forward. These contract roll periods frequently introduce short-term mathematical distortions onto the daily chart, independent of physical metal fundamentals.
The Science Behind Silver Price Charts: What You Need to Know About Volatility
Silver is colloquially known as the "devil's metal" among commodities traders due to its aggressive price swings. This volatility is not an accident of nature; it is a mathematical outcome of market capitalization and systemic beta.
The High-Beta Relationship to Gold
Statistically, silver exhibits a beta of roughly 1.5 to 2.0 relative to gold. If gold advances by 10% during a macroeconomic shift, silver historically advances by 15% to 20% over the same duration. Conversely, when gold drops 5%, silver frequently retreats by 8% to 10%.
This dynamic occurs because institutional capital pools treat gold as the primary monetary proxy. Once gold establishes a confirmed trend, speculative capital rotates into silver to capture higher percentage returns on a smaller, more responsive asset base.
The Supply-Side Inelasticity Problem
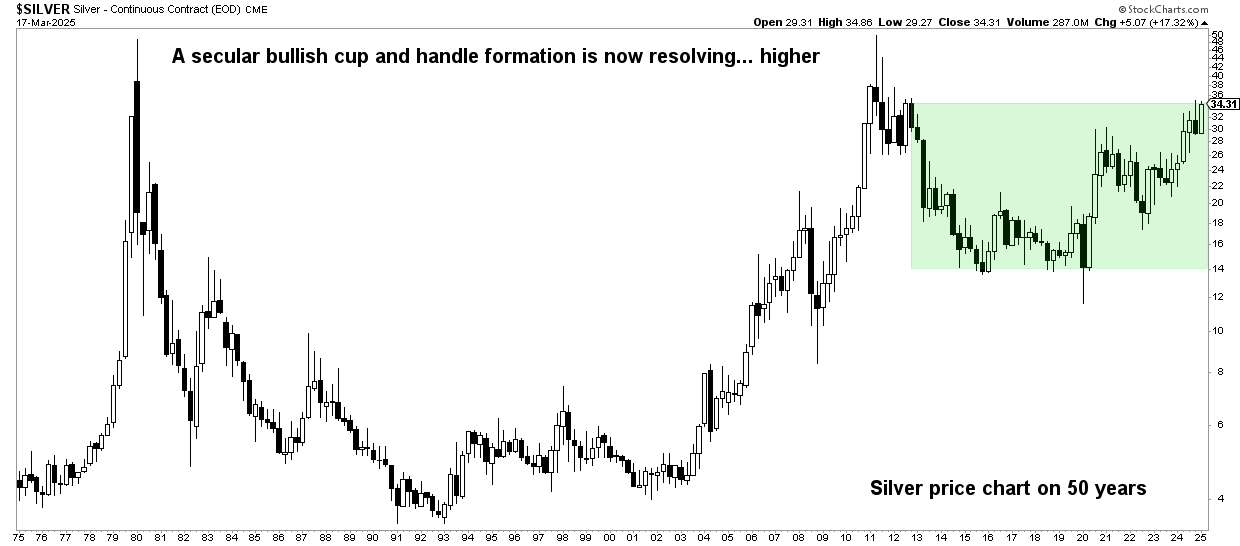
On a traditional commodity chart, rising prices incentivize miners to produce more supply, which eventually caps the rally. Silver charts regularly defy this classical economic feedback loop because approximately 70% to 75% of global silver output is extracted as a byproduct of mining for lead, zinc, copper, and gold.
Even if silver prices double on the chart, a primary copper or zinc miner will not fundamentally alter their mining operations solely to produce more byproduct silver. As a result, supply remains structurally constrained, allowing technical breakouts on the chart to run much further and faster than standard supply-demand models predict.
Quantitative Metrics and Statistical Indicators That Matter
Reading a silver price chart scientifically requires looking past simplistic trendlines and evaluating quantitative indicators grounded in statistical probability.
1. The Gold-to-Silver Ratio (GSR)
The Gold-to-Silver Ratio measures how many ounces of silver are required to purchase one ounce of gold. It is one of the most reliable mean-reverting indicators in financial history:
- Historical Modern Mean: Throughout the 20th and 21st centuries, the GSR has maintained a median trading band between 50:1 and 65:1.
- Extreme Overbought Extremes: When the ratio climbs above 80:1 or 90:1, silver is statistically undervalued relative to gold. On a long-term silver chart, these periods consistently mark major multi-year bottoms.
- Blow-Off Tops: When the ratio compresses toward 30:1 or 40:1, silver has entered a parabolic speculative phase, typically signaling that a macro cycle top is near.
2. Volume Profile and Liquidity Nodes
Standard volume bars display volume over time, but Volume Profile displays volume at specific price levels. Silver tends to respect High Volume Nodes (HVNs)—price areas where heavy institutional accumulation took place—as robust support and resistance zones. Conversely, Low Volume Nodes (LVNs) represent price vacuums where the metal moves rapidly with little resistance.
3. Standard Deviation Bands (Bollinger Bands)
Because silver undergoes extended periods of low volatility followed by explosive expansions, 20-period, 2-standard-deviation Bollinger Bands provide concrete statistical signals. A phenomenon known as the "Bollinger Squeeze" occurs when historical volatility drops to multi-month lows; for silver, this mathematically foreshadows an imminent, sharp breakout as liquidity pools realign.
Structural Shifts: The Modern Green Energy Squeeze
Recent silver charts reflect a shift that traditional traders often misread: persistent, structural annual supply deficits. The global pivot to renewable infrastructure has introduced non-discretionary industrial demand that is altering historical chart patterns.
Advanced n-type solar cells (such as TOPCon and Heterojunction technologies) require between 30% and 80% more silver paste per watt than older p-type PERC cells. As solar installations break annual global records, silver inventories in London and New York warehouses are drawn down continuously. When chart analysts identify descending inventory lines converging with rising price floors, they are witnessing physical scarcity pricing out paper market positioning.
Conclusion: Reading the Chart with Quantitative Discipline
A silver price chart is not an enigma; it is a high-resolution map of real-time macroeconomic equations. Behind every support retest and explosive breakout lies the interplay of inelastic byproduct mining, institutional order-book sweeps, monetary hedging, and green industrial consumption.
To navigate the silver market successfully, replace speculative emotional reactions with systematic observation. Track the Gold-to-Silver Ratio, monitor real interest rate yields, map institutional volume nodes, and recognize that volatility is not a defect of the silver chart—it is its defining structural characteristic.