Understanding the Tornado Possibility Map for Safety
Understanding the Tornado Possibility Map
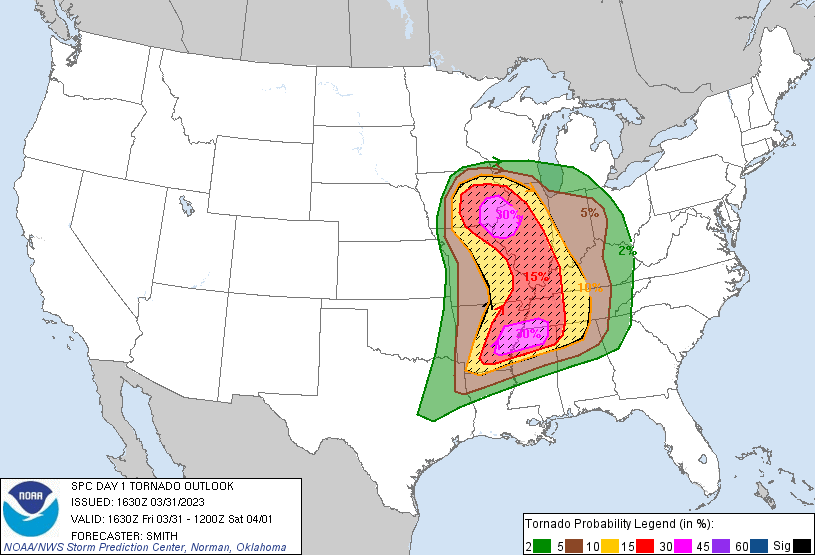
Tornadoes are among the most violent and unpredictable forces of nature. While they can occur anywhere in the world under the right atmospheric conditions, certain regions experience them far more frequently than others. To visualize these geographic risks, meteorologists and emergency management agencies rely heavily on a tornado possibility map.
These specialized maps use decades of historical weather data, climate patterns, and geographic indicators to show where tornadoes are most likely to form. Whether you are moving to a new state, planning disaster readiness for your family, or simply curious about severe weather climatology, understanding these hazard maps is an essential part of staying safe.
How Tornado Possibility Maps Are Created
A modern tornado risk map is not created overnight. It is the result of decades of meteorological observation, radar technology advancements, and rigorous statistical analysis. Scientists look at multiple layers of data to determine the baseline probability of a tornado touching down in a specific area.
Historical Data and Frequency
The foundation of any probability map is historical records. Agencies like the National Oceanic and Atmospheric Administration (NOAA) and the Storm Prediction Center (SPC) track every recorded tornado in the United States and globally. By looking at data spanning 30, 50, or even 100 years, researchers can calculate the average number of tornadoes per square mile in a given county or region.
Atmospheric Ingredients
Beyond looking backward at past events, maps also account for the physical geography and climatology that favor tornado formation. Key ingredients include:
- Low-level moisture: Sourced largely from large bodies of water like the Gulf of Mexico.
- Instability: Warm air near the surface capped by cooler air aloft, which allows thunderstorms to grow tall and violent.
- Wind shear: Changes in wind speed and direction with height, which creates the rotation necessary for supercells.
Decoding the Risk Zones: Where Do Tornadoes Happen?
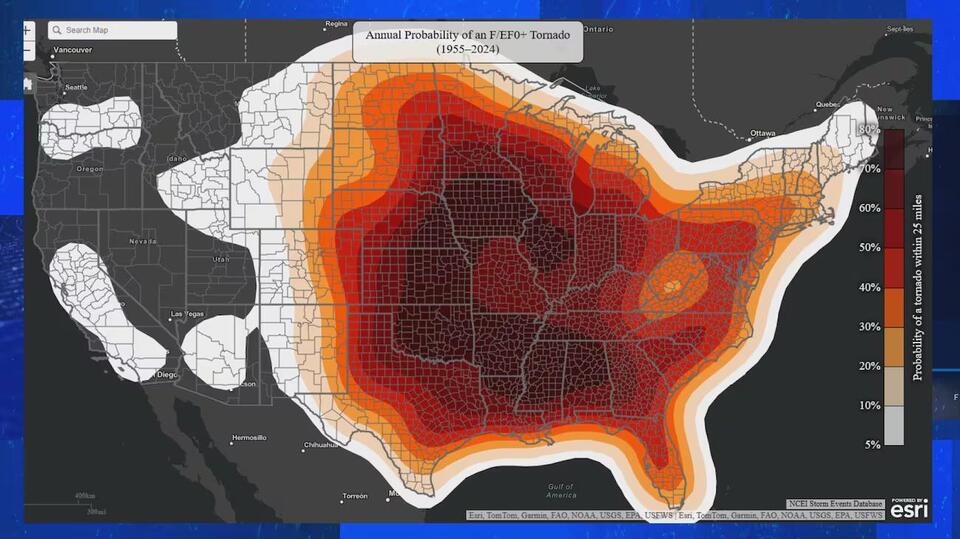
When looking at a national tornado frequency map, certain patterns immediately stand out. While Tornado Alley gets the most media attention, the geography of risk is actually much more complex and widespread.
Traditional Tornado Alley
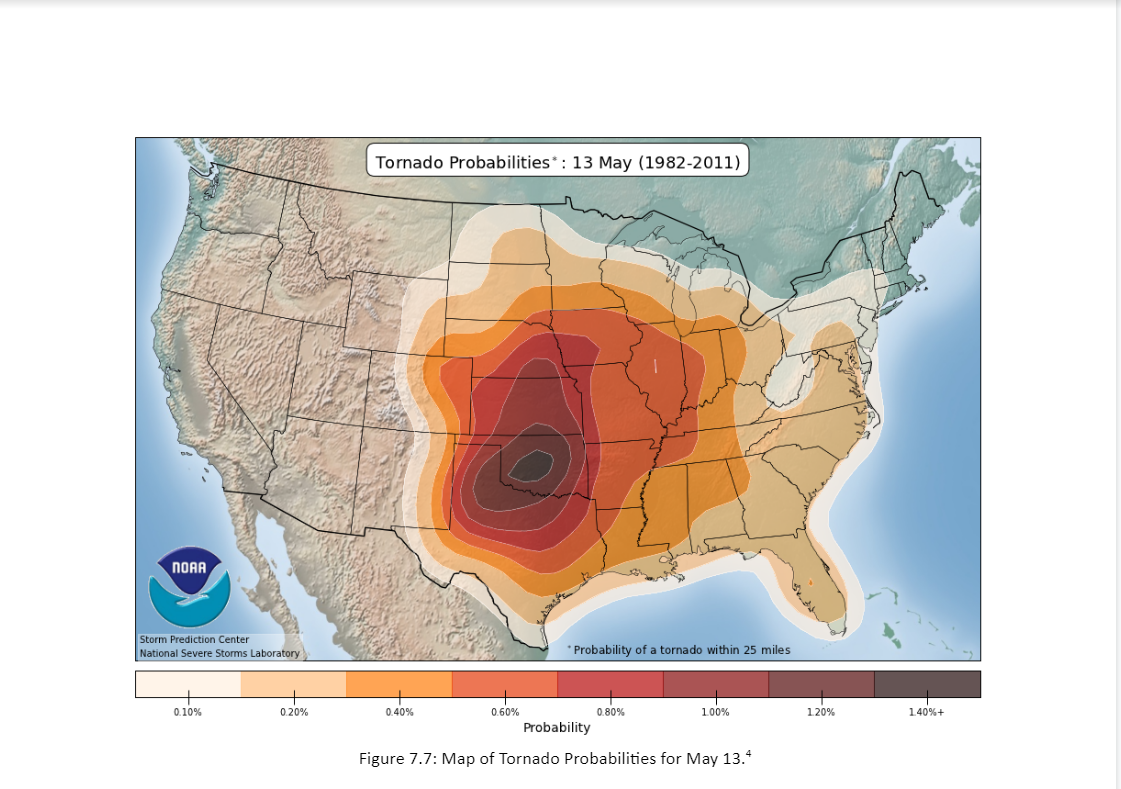
Stretching from northern Texas through Oklahoma, Kansas, Nebraska, and parts of Iowa and South Dakota, Tornado Alley remains the most well-known high-risk zone. Here, dry air from the Rockies meets warm, moist air from the Gulf of Mexico, creating an ideal laboratory for severe thunderstorms during the spring and early summer months.
Video: Tornado probabilities by day

Dixie Alley
In recent decades, meteorologists have paid increased attention to Dixie Alley, which encompasses much of the American Southeast, including Mississippi, Alabama, Georgia, and Tennessee. A tornado possibility map for this region reveals high hazard levels, often driven by fast-moving winter and spring storm systems. Tornadoes in this region are particularly dangerous because they are frequently rain-wrapped, occur at night, and strike densely populated rural and forested areas.
The Myth of Natural Barriers
A common misconception is that rivers, mountains, or large cities can prevent tornadoes. Historical data disproves this entirely. Tornadoes have crossed the Mississippi River, climbed the Appalachian Mountains, and struck downtown metropolitan areas. A comprehensive risk map demonstrates that no region east of the Rocky Mountains is completely immune to severe convective storms.
How to Use Risk Maps for Emergency Preparedness
Knowing your local risk level is the first step in severe weather safety. A tornado possibility map helps homeowners, builders, and city planners make informed decisions about infrastructure and personal safety.
Evaluating Building Standards
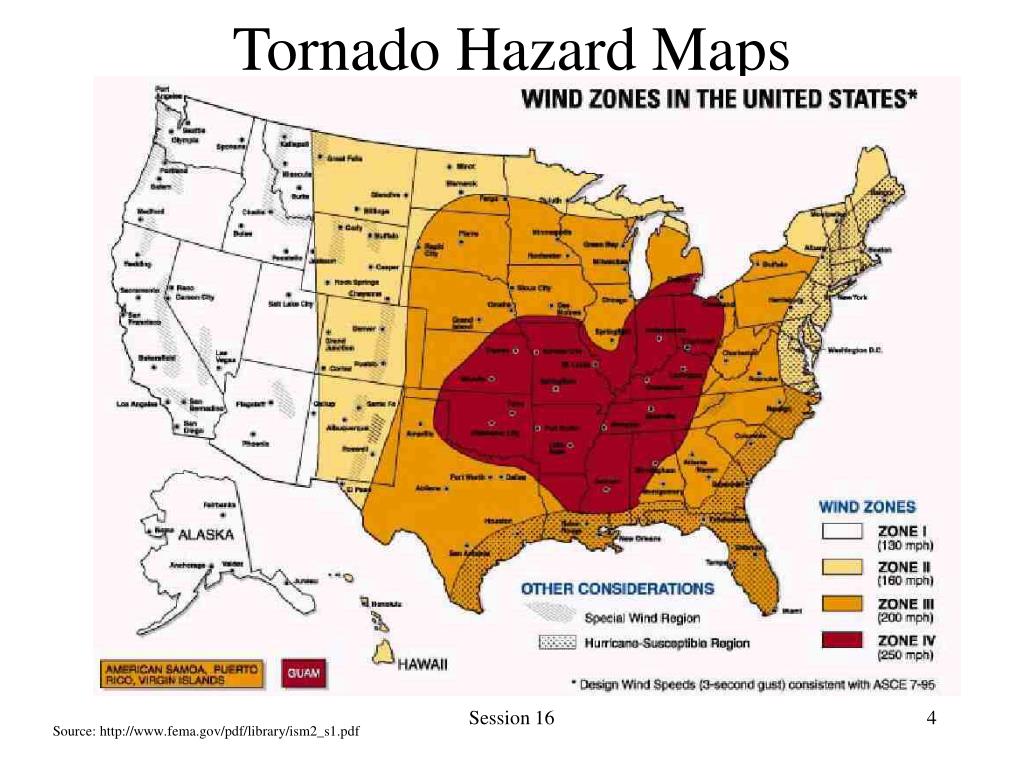
Construction requirements often reflect local severe weather probabilities. Areas marked as high-risk on hazard maps may have stricter building codes regarding roof-to-wall ties, reinforced garage doors, and wind-resistant materials. For homeowners, understanding your local risk can prompt investments in safe rooms or storm shelters.
Developing a Family Action Plan
Regardless of whether you live in a high-risk or moderate-risk zone, every household needs a severe weather plan. Consider the following steps:
- Identify the safest room in your home, such as a basement, storm cellar, or an interior windowless room on the lowest floor.
- Sign up for local weather alerts through smartphone apps, NOAA weather radios, or municipal warning systems.
- Prepare an emergency supply kit containing water, non-perishable food, flashcards, a battery-powered radio, and first-aid supplies.
- Conduct regular drills with your family so everyone knows what to do when a tornado watch or warning is issued.
The Dynamic Nature of Severe Weather Forecasting
It is important to remember that a climate-based risk map differs significantly from a daily forecast. While a possibility map shows long-term probabilities over a year or a decade, actual day-to-day preparedness relies on real-time weather monitoring.
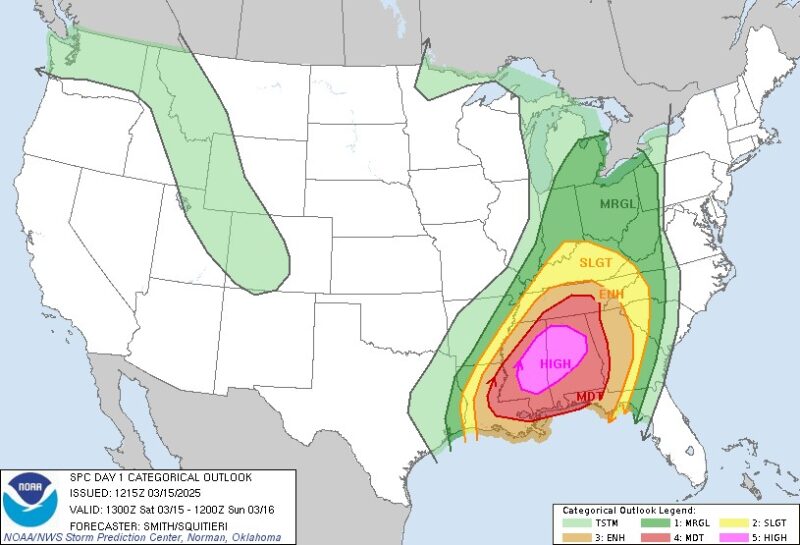
On any given day, the Storm Prediction Center issues convective outlooks ranging from Marginal to High Risk. These short-term forecasts combine radar data, atmospheric sounding, and computer models to predict where tornadoes might form hours in advance. By pairing an understanding of long-term climate maps with daily weather vigilance, you can protect your home and family from the unpredictable nature of severe storms.