Unique R290 Pressure Temperature Chart Uses
When technicians and engineers think of hydrocarbon refrigerants, their minds usually jump straight to safety protocols, charge limits, and standard cooling performance. At the center of working with propane—commercially known as R290—lies a critical diagnostic tool: the pressure-temperature (PT) relationship. While most professionals rely on standard guidelines, Breaking the Mold: Unique R290 Pressure Temperature Chart Uses You Must Know reveals how this foundational data can be leveraged for advanced diagnostics, energy optimization, and specialized engineering tasks.

As global regulations phase out traditional HFCs in favor of natural refrigerants with ultra-low Global Warming Potential (GWP), mastering R290 has become an essential industry skill. By looking beyond the basics, technicians can extract far more value from a standard R290 pressure temperature chart than simple superheat and subcooling calculations.
Understanding the Basics of R290 PT Dynamics
Before diving into unconventional applications, it is vital to understand why R290 behaves differently than older refrigerants like R22 or R134a. Propane has unique thermodynamic properties, offering high volumetric cooling capacity and excellent energy efficiency. However, because it operates at specific pressure thresholds relative to ambient temperatures, precise tracking via a dedicated PT chart is mandatory.
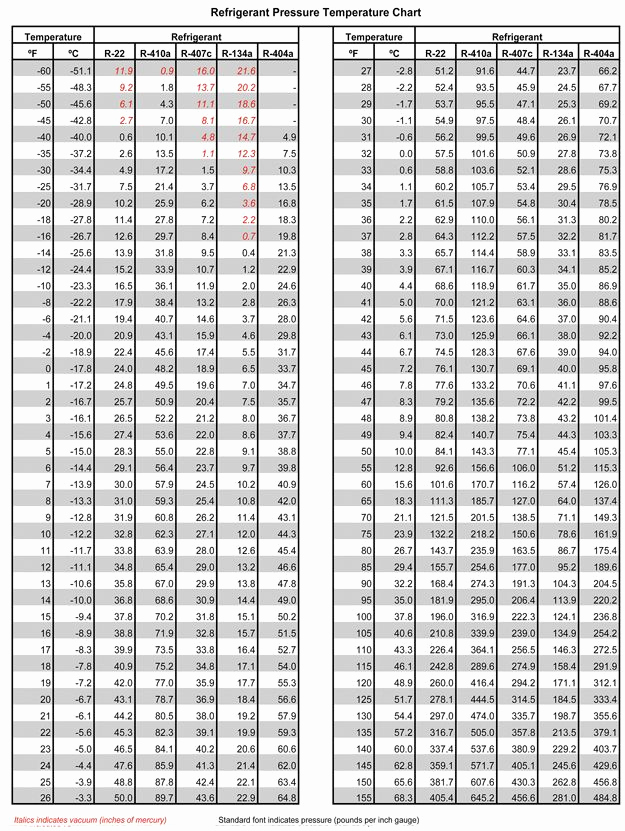
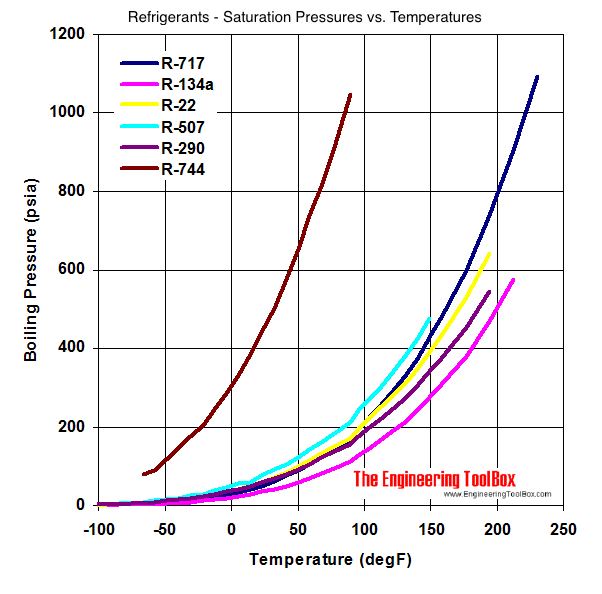
A standard PT chart matches saturation pressure (measured via manifold gauges) with its corresponding boiling or condensation temperature. In normal scenarios, this helps you verify refrigerant purity, check for non-condensables, and ensure the evaporator or condenser is operating at peak design parameters. However, innovative technicians are finding ways to stretch these data points into entirely new operational workflows.
Unique Applications for the R290 Pressure Temperature Chart
1. Detecting Micro-Contamination and R290 Purity Issues
Because R290 is a pure substance (unlike zeotropic blends that glide), its saturation temperature at a given pressure is a fixed, absolute constant. Advanced service technicians use this property as a field purity test.
Allow the system to sit off until the refrigerant reaches ambient temperature.
Measure the static pressure using an accurate digital gauge.
Cross-reference that pressure with your R290 PT chart.
If the measured temperature derived from the pressure deviates significantly from a calibrated ambient thermometer reading, it indicates the presence of air, moisture, or a compromised hydrocarbon blend.
2. Optimizing Variable-Speed Compressor Modulation

Modern commercial refrigeration units utilizing R290 often feature variable-speed (inverter) compressors. Fine-tuning these compressors for maximum efficiency requires looking closely at how evaporating pressures shift under varying thermal loads.
By mapping out target evaporating temperatures on an R290 chart against actual load conditions, automation engineers can program tighter PID loops. This prevents short-cycling, reduces compressor wear, and trims unnecessary electrical consumption in walk-in coolers and display cases.
3. Precision Superheat Tuning in Cryogenic and Ultra-Low Temp Cabinets
While R290 is mostly known for medium-temperature applications, it is increasingly adopted in specialized low-temperature cascades or bespoke laboratory freezers. At lower evaporating temperatures, pressure differentials shrink dramatically, making measurement errors catastrophic to compressor health.
Using a high-resolution R290 pressure temperature chart allows technicians to calculate low-side superheat with extreme accuracy, preventing liquid slugging while maintaining the narrow evaporator margins required in scientific and medical storage environments.
4. Hydrocarbon Recovery Cylinder Management
Recovering flammable refrigerants requires strict adherence to fill limits and internal tank pressures. Ambient temperature swings directly impact liquid expansion inside recovery cylinders.
Safety officers and recovery technicians use R290 PT charts to predict maximum allowable cylinder pressures based on storage facility temperatures. This ensures that recovery tanks are never overpressurized during hot summer months, drastically lowering the risk of pressure relief valve discharge or cylinder compromise.
Best Practices for Accurate Field Measurement
Utilizing a PT chart for advanced diagnostic tasks requires high-precision instrumentation. Standard analog gauges can suffer from calibration drift, leading to misinterpretations of the R290 saturation curve.
- Invest in Digital Manifolds: Digital gauges automatically calculate saturation temperatures, minimizing human math errors in high-stress field environments.
- Account for Altitude: Atmospheric pressure changes affect absolute pressure readings. Always zero your gauges properly or use absolute pressure conversions when working at high elevations.
- Ensure Thermal Equilibrium: Never take static pressure readings for purity checks while the compressor is running or immediately after shutdown. Give the system time to stabilize.
Conclusion
The transition to eco-friendly hydrocarbons demands a deeper technical proficiency from modern engineers and technicians. The R290 pressure temperature chart is much more than a routine reference sheet—it is a powerful diagnostic window into system health, refrigerant purity, and energy efficiency. By adopting these unique and advanced methodologies, professionals can ensure safer installations, lower operational costs, and maximize the lifespan of R290-based refrigeration equipment.