Unlock Fantasy Football Success with Trade Value Charts
Trading in fantasy football is often where championships are won or lost. Yet, most managers approach negotiations using gut feeling, box score chasing, or emotional attachments to players they drafted. If you want to consistently outmaneuver your league mates and upgrade your roster, you need an objective framework. When you learn how to unlock fantasy football success with trade value charts, you transform trading from an awkward guessing game into a calculated, repeatable competitive edge.

What Is a Fantasy Football Trade Value Chart?
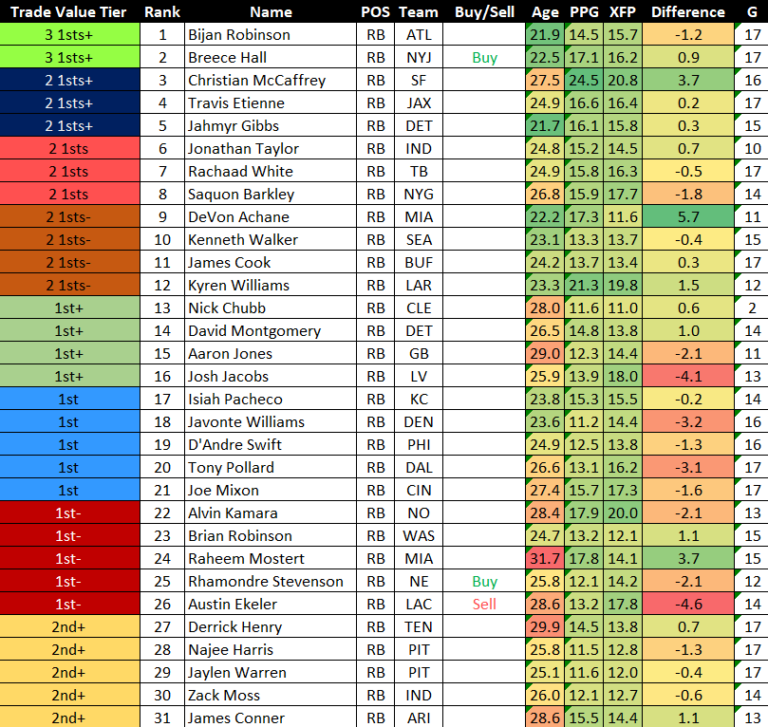
A fantasy football trade value chart assigns a numerical score to every relevant player in the league. Instead of trying to guess whether an RB2 is worth a WR1, these charts translate player production, projected volume, and positional scarcity into a single universal currency.
Most reputable charts are built using a concept known as Value Over Replacement Player (VORP). VORP measures how many more fantasy points a player scores compared to a baseline waiver wire option at their position. Because running backs and elite tight ends often decline sharply after the top tiers, their replacement value baseline is much lower than wide receivers, making top-tier players at scarce positions inherently more valuable.
The Psychology of Trading: Why Gut Instinct Fails
Most trade talks collapse before they even begin due to cognitive biases. Understanding these hurdles explains why an objective chart is indispensable:
- The Endowment Effect: Managers overvalue players they already own simply because they own them. A chart offers an external, unbiased benchmark that curbs this instinct.
- Recency Bias: If a player explodes for three touchdowns on Sunday, their manager will treat them like a league-winner on Tuesday. Value charts factor in rest-of-season volume and regression rather than single-game anomalies.
- Loss Aversion: Many managers refuse to trade because they are terrified of "losing" the deal. Presenting values derived from a respected market consensus helps reassure hesitant trade partners.
How to Unlock Fantasy Football Success with Trade Value Charts
Simply glancing at a chart isn't enough; you need a system to exploit the numbers in live negotiations. Here is how to apply trade value metrics effectively throughout your season.
1. Identify Market Discrepancies
Value charts reflect aggregate consensus, but your home league behaves uniquely. Compare a consensus trade chart against public sentiment in your league. If a chart values an underperforming, high-volume wide receiver at 35 points, but your league mate views him as an unusable bust, you have discovered an actionable buy-low window.
2. Execute the "2-for-1" Consolidation Trade
One of the most effective strategies in fantasy football is trading two solid starters for one elite, top-tier asset. A trade value chart shows you why this is tricky—and how to execute it properly.
In most charts, simple math does not tell the whole story. Two players valued at 20 points each do not equal one player valued at 40 points. The team giving up the 40-point player must clear a roster spot, effectively taking on a replacement-level player. To convince a competitor to part with a superstar, you generally need to provide an overpay in raw numerical value (for example, offering 45 to 50 combined points of value for a 40-point stud).
3. Align Values with Roster Needs

A trade chart is an objective baseline, but roster context determines utility. A manager sitting at 2-6 cannot afford to wait on an injured star or a rookie who might break out in Week 13. Conversely, a 7-1 juggernaut can easily absorb short-term volatility in exchange for long-term playoff ceiling. Use the chart to target teams whose standings and positional weaknesses make them vulnerable to your trade surplus.
Navigating Formats: PPR, Superflex, and TE Premium
A common mistake is using a generic chart for a specialized league format. Value distributions change drastically based on your league settings:
- PPR vs. Standard: In full-PPR leagues, target-earning pass-catchers and third-down backs skyrocket in value. In standard (non-PPR) formats, goal-line rushers with touchdown equity dominate the upper tiers.
- Superflex (2QB): In single-quarterback leagues, middle-tier QBs hold almost zero trade value because replacement options populate the waiver wire. In Superflex formats, starting quarterbacks become the most valuable commodity on the board.
- Tight End Premium (TEP): When tight ends receive 1.5 or 2.0 points per reception, upper-echelon tight ends become comparable to top-five running backs and wide receivers.
Common Pitfalls When Using Trade Charts
While trade value charts are powerful tools, relying on them blindly can derail your season. Avoid these common missteps:
The "Three Quarters for a Dollar" Fallacy
Never send an offer featuring three bench players whose values happen to sum up to Christian McCaffrey or Justin Jefferson. High-end roster spots are strictly limited. Points generated by a single starting lineup spot cannot be matched by depth sitting on the bench.
Ignoring Weekly Updates
Fantasy landscapes change overnight due to injuries, depth chart changes, and offensive coordinator tendencies. A trade value chart published in Week 2 is practically useless by Week 6. Always ensure you are consulting data that reflects the current week's news and usage trends.
Sending the Chart as "Proof"
Never link a trade value chart in your league chat or trade proposal with a message saying, "Look, this chart says it's fair." Doing so comes across as patronizing and puts your trade partner on the defensive. Instead, use the chart quietly to structure your offer, then pitch the trade based on how it solves your partner's specific lineup holes.
Putting It All Together
Trade value charts remove the emotional noise from fantasy football negotiations. By understanding positional scarcity, accounting for your league's scoring system, and recognizing roster-specific leverage, you can systematically construct offers that appeal to your opponents while consistently upgrading your starting lineup. Bookmark a trusted chart, monitor it weekly, and turn the trade market into your greatest competitive advantage.