Water Temperature in Myrtle Beach SC: Month-by-Month
Planning a trip to the Grand Strand often comes down to one critical question: is the ocean actually warm enough for a swim? Tracking the water temperature in Myrtle Beach SC helps you decide whether to pack a lightweight swimsuit, a rash guard, or a full neoprene wetsuit. Because the Atlantic Ocean warms and cools much slower than coastal air, the water conditions you encounter in spring, summer, fall, and winter can vary dramatically.
The Factors Driving Myrtle Beach Ocean Temperatures
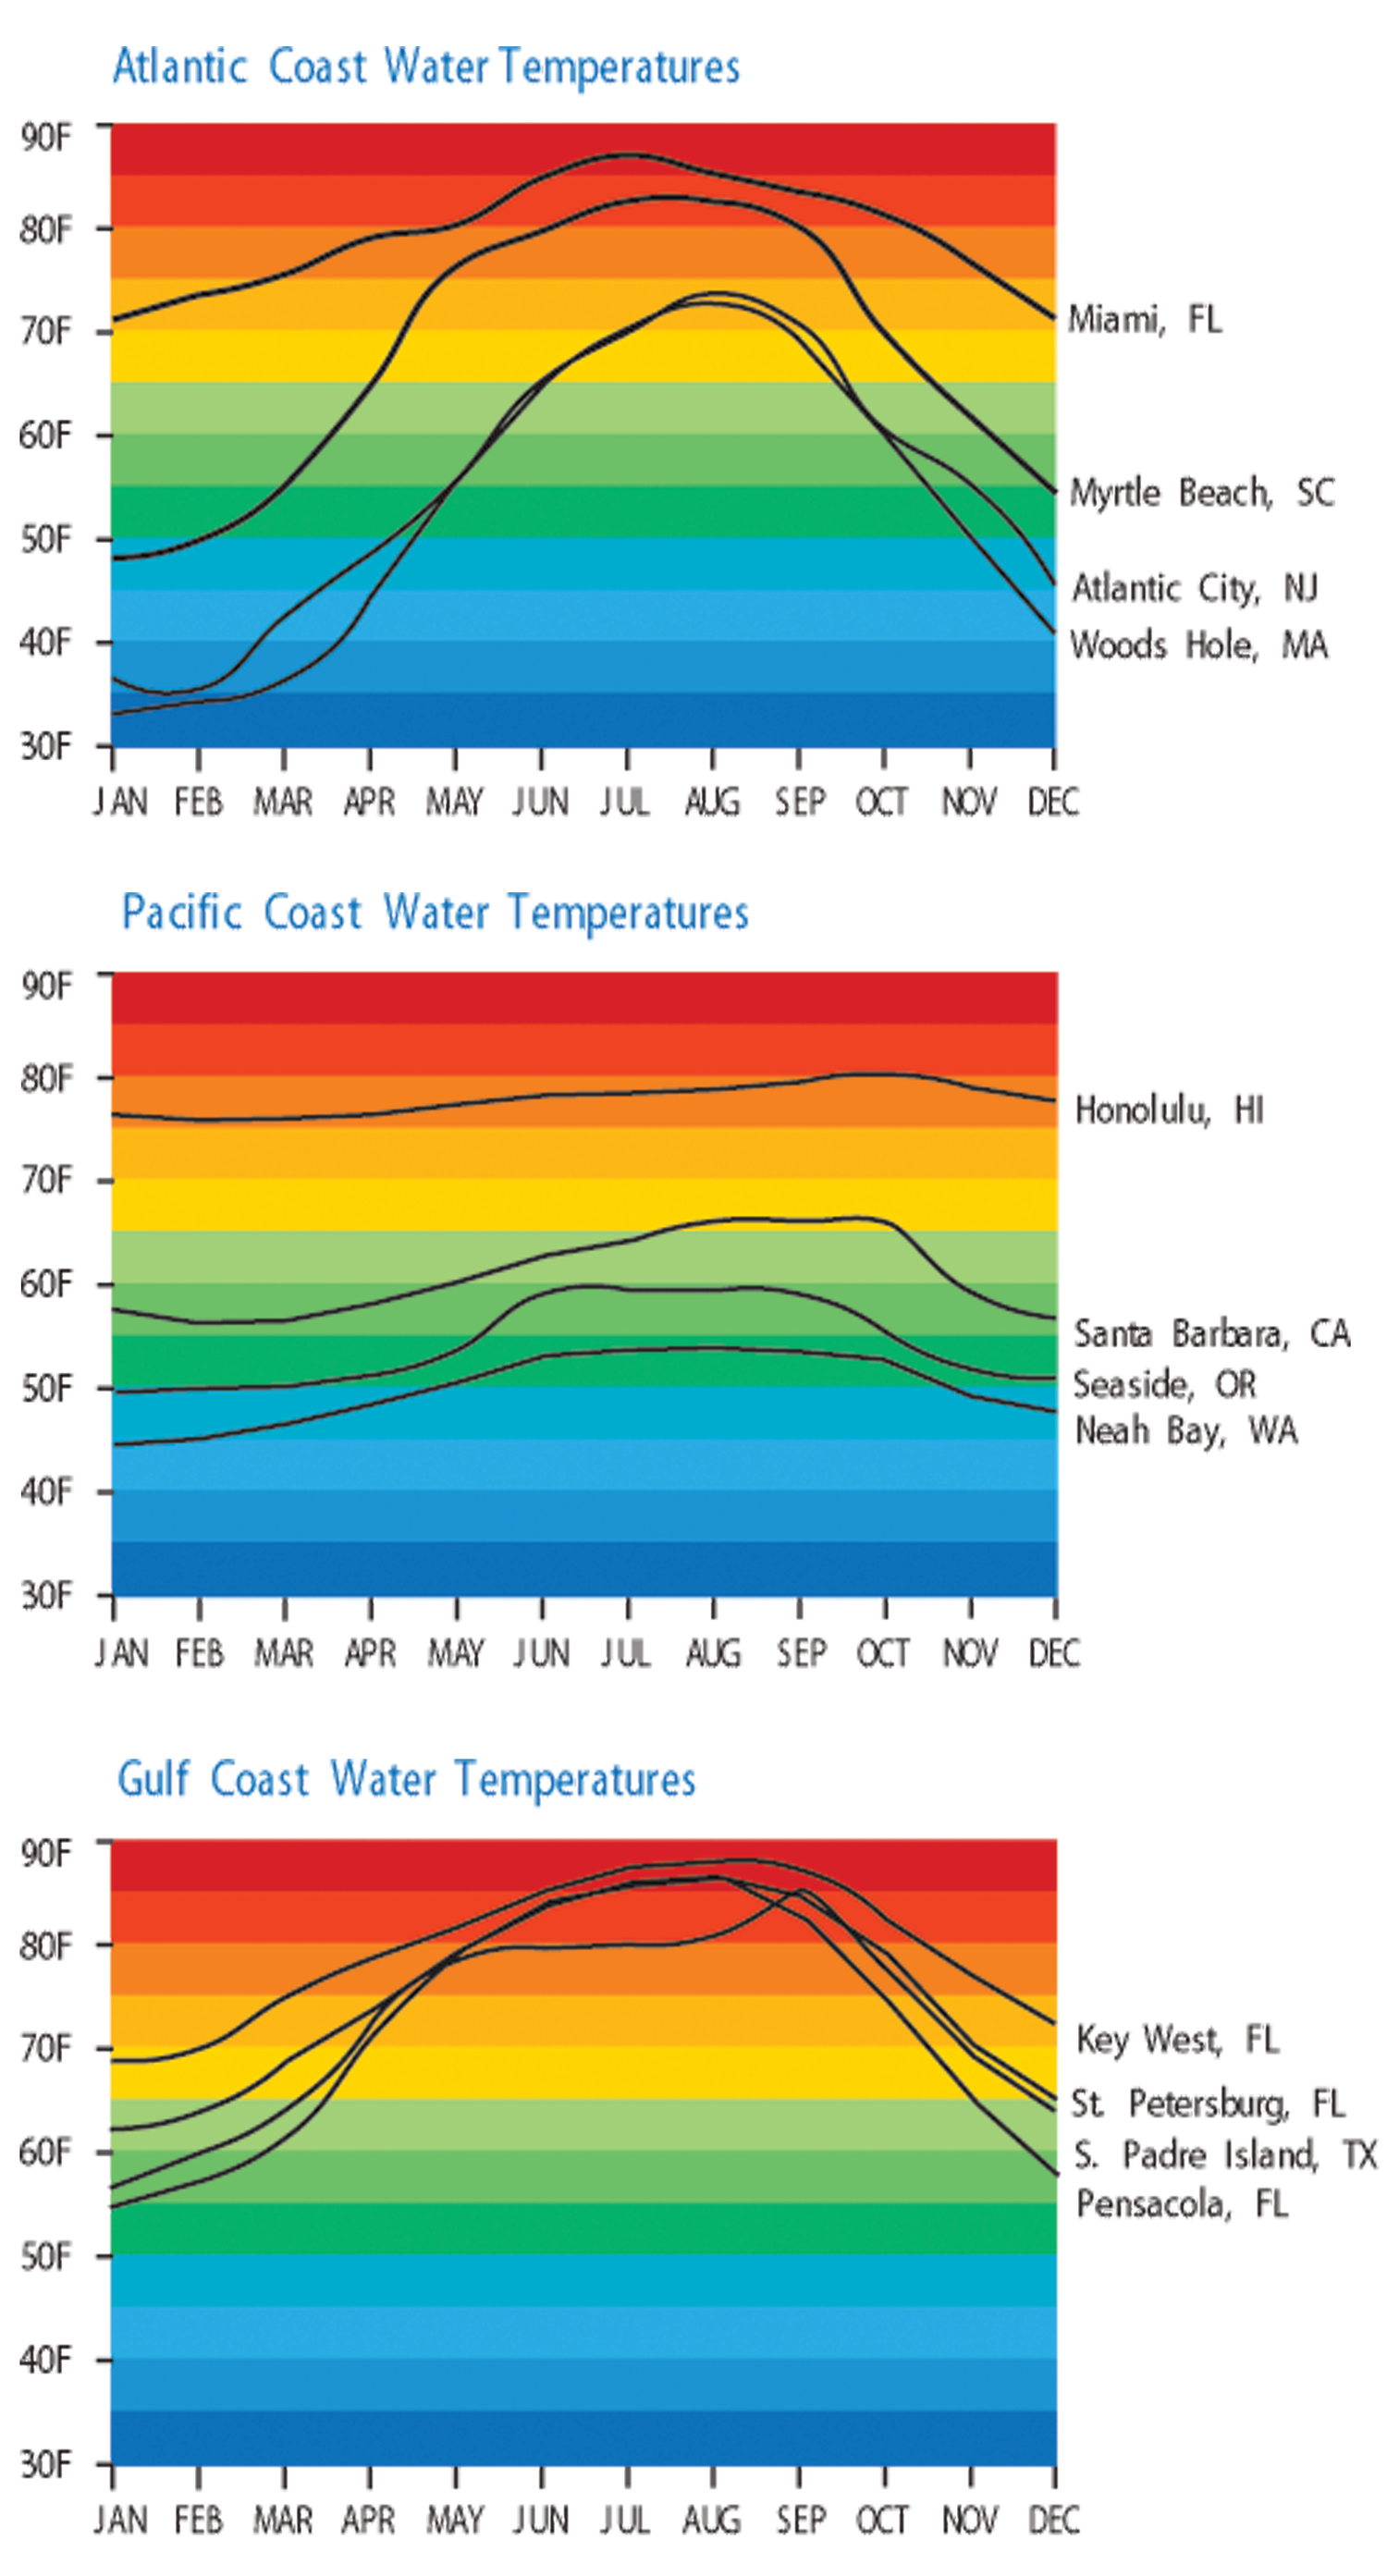
Myrtle Beach sits in the South Atlantic Bight, a gentle curve along the southeastern coast where ocean dynamics create distinct seasonal shifts. Unlike northern Atlantic destinations that stay chilly well into June, South Carolina benefits from southern subtropical currents and long stretches of strong solar heating.
While the Gulf Stream runs offshore roughly 50 to 70 miles southeast of Myrtle Beach, its warm ribbon of tropical water frequently sheds warm eddies toward the coastline during late spring and summer. Conversely, winter brings continental cold fronts and occasional coastal upwelling that lower nearshore readings into the 50s. Wind direction also plays a key role: prevailing southerly winds in summer push warm surface water toward the surf zone, while strong offshore or northerly winds in early spring can drive surface water away and draw up colder depths.
Monthly Breakdown: Water Temperature in Myrtle Beach SC
To help you prepare your itinerary, here is what you can expect in the ocean throughout the year, measured across historical coastal averages near the Myrtle Beach surf zone and local fishing piers.
January (Average: 53°F / 12°C)
January delivers the coldest water of the year. Coastal currents pull chilly water down the coast, keeping the surf in the lower 50s. Leisure swimming is non-existent without thermal protection. Surfers who head out during winter swells require a 4/3mm wetsuit, neoprene boots, and often a hood and gloves to stay in the lineup for more than thirty minutes.
February (Average: 54°F / 12°C)
Ocean temperatures bottom out in early February before stabilizing toward the end of the month. Water readings hover between 52°F and 55°F. While sunny afternoons can produce mild air temperatures, the ocean requires heavy thermal gear for any extended watersports.
March (Average: 58°F / 14°C)
March marks the beginning of spring, but the ocean responds slowly. Even as daytime highs reach the upper 60s or low 70s on land, ocean readings sit in the upper 50s. Quick wading is common among spring breakers, but immersion feels sharp and brisk. Surfers usually transition from winter suits down to a solid 3/2mm fullsuit.
April (Average: 65°F / 18°C)
By mid-to-late April, the ocean gains noticeable momentum, climbing into the mid-60s. For casual beachgoers, this range feels bracing but manageable for a short plunge on a bright, sunny afternoon. Swimmers prone to chilling will prefer to wait, while paddleboarders and kayakers can get away with a light springsuit or neoprene top.
May (Average: 73°F / 23°C)
May is the official kickoff to comfortable ocean recreation. The surf consistently crosses the 70°F threshold, and by Memorial Day weekend, nearshore readings frequently touch 75°F. Most vacationers find this temperature refreshing rather than cold, making it ideal for swimming, boogie boarding, and open-water wading without specialized gear.
June (Average: 80°F / 27°C)
June brings pure summer conditions. Ocean temperatures sit squarely around 79°F to 81°F. Entering the surf feels effortless, with zero initial shock. It is prime season for families, swimmers of all skill levels, and water sports enthusiasts who want to spend hours in the surf in standard swimwear.
July (Average: 84°F / 29°C)
July features some of the warmest ocean readings along the East Coast. Water temperatures hover in the mid-80s, offering little thermal relief from scorching beach heat, yet providing comfortable, bathwater-like conditions. You can stay in the ocean indefinitely without getting cold.
August (Average: 85°F / 29°C)
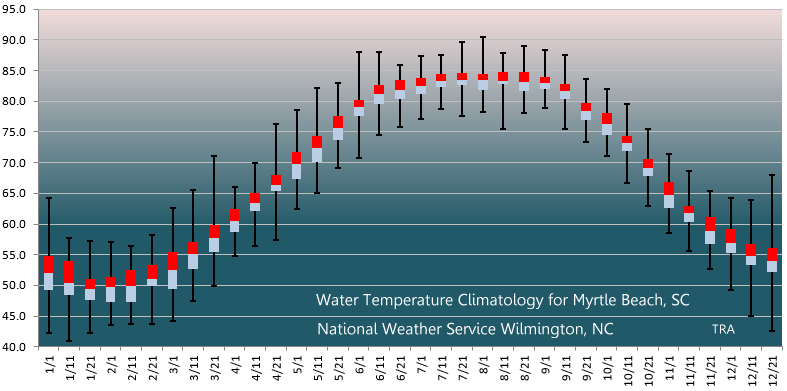
August registers the annual peak for ocean heat in Myrtle Beach. The surf regularly reaches 84°F to 86°F. Shallow tide pools and sheltered shallows feel like a warm tub. It is the peak month for swimming and snorkeling around nearshore structures, though high temperatures also mean marine life is active.
September (Average: 81°F / 27°C)
September is considered by many locals to be the finest month on the Grand Strand. While humidity drops and summer crowds disperse, the ocean retains the heat stored over July and August. Water temperatures remain in the low 80s for most of the month, making post-Labor Day trips extraordinarily pleasant for swimming.
October (Average: 73°F / 23°C)
The autumn cooldown begins in earnest during October, but the water remains remarkably hospitable compared to the air. Expect readings to range from the upper 70s at the start of the month to around 70°F by Halloween. A light windbreaker or rash guard helps manage breezy exits from the surf.
November (Average: 64°F / 18°C)
Water temperatures drop swiftly in November as cold fronts sweep down the coast. The surf falls back into the mid-to-lower 60s. While dedicated surfers and distance swimmers in wetsuits remain active, general swimming drops off sharply as beachgoers shift toward strolling and pier fishing.
December (Average: 57°F / 14°C)
December returns the Atlantic to its cold winter state, with surf temps falling into the upper 50s. Ocean activity is limited to hearty surfers in 3/2mm or 4/3mm suits and participants in annual charity polar plunges.
When Is Myrtle Beach Ocean Water Best for Swimming?
Thermal comfort depends on personal sensitivity, but most swimmers classify coastal water temperatures into three distinct brackets:
- Too Cold for General Swimming (Under 68°F / 20°C): Common from November through mid-April. Extended immersion causes numbness and shivering without protective neoprene.
- Brisk but Swimmable (68°F to 75°F / 20°C to 24°C): Typical in late April, May, and late October. Entering the water takes a moment of adjustment, but vigorous swimming feels invigorating.
- Peak Swimming Comfort (76°F to 85°F / 24°C to 29°C): Standard from late May through early October. Entering the water requires no acclimation, making this the golden window for families, children, and casual floaters.
Wetsuit Thickness Guide for Surfers and Watersports
If you plan to surf, foil, or kiteboard in Myrtle Beach outside the peak summer months, having the right gear ensures you stay warm:
- Mid-May through September: Boardshorts or swimsuits; optional UV rash guard.
- October and April: Neoprene top or 2mm shorty springsuit.
- March and November: 3/2mm full wetsuit.
- December through February: 4/3mm full wetsuit paired with 3mm booties; a hood is recommended during brisk offshore winds.
How Ocean Warmth Affects Marine Life and Beach Safety
Rising water temperatures change more than just your personal comfort—they alter the coastal ecosystem:
Jellyfish Activity
As nearshore waters climb past 80°F in July and August, cannonball jellyfish and sea nettles become more common in the surf zone. While cannonball jellies are generally harmless to humans, sea nettles can deliver a mild, uncomfortable sting. Keeping an eye on water clarity and lifeguard flags helps avoid unexpected encounters.
Afternoon Thunderstorms and Rip Currents
Warm ocean water fuels localized atmospheric instability. During July and August, afternoon sea-breeze collisions frequently spawn brief, intense thunderstorms. When swimming during the warmest months, monitor the sky and heed lifeguard whistles. Rip currents are also unrelated to water warmth; always check daily beach hazard flags regardless of how welcoming the sea feels.
How to Check Real-Time Sea Conditions
While monthly averages offer an accurate baseline, day-to-day weather events can cause ocean temperatures to swing by three to five degrees over a single weekend. To get the most accurate current reading before hitting the sand, consult observations from:
- NOAA Buoy Stations: Nearshore monitoring stations like buoy 41013 provide live sea-surface temperatures.
- Local Pier Reports: Springmaid Pier and 2nd Avenue Pier regularly log surface water measurements directly in the breaker line.
- Lifeguard Stands: City beach patrol units routinely post surf conditions, rip current risk levels, and water temperatures on morning hazard boards.


