Weather Radar Fleming Island: Real-Time Local Guide
When monitoring storms in northeastern Florida, having reliable access to weather radar in Fleming Island is essential for everyday planning and emergency preparedness. Located between Doctors Lake, Black Creek, and the western bank of the St. Johns River, Fleming Island experiences a distinct microclimate shaped by inland heating, river breezes, and the collision of coastal boundaries. Understanding how local radar tools work—and how to interpret what they show—allows residents, boaters, and commuters to stay ahead of fast-developing severe weather.
The Radar Source Behind Fleming Island Weather
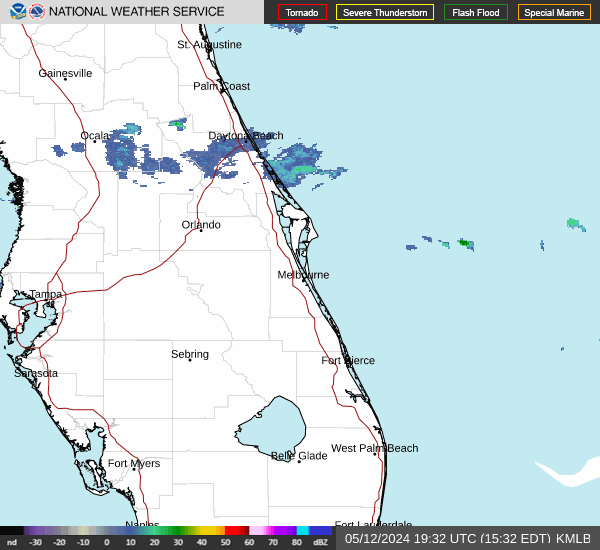
Fleming Island does not have a dedicated radar tower on the island itself; instead, it relies primarily on the National Weather Service (NWS) NEXRAD WSR-88D station designated as KJAX. Situated just north of Jacksonville International Airport, the KJAX radar sits roughly 28 to 32 miles north of Fleming Island.
Because radar beams travel upward at an angle as they radiate away from the transmitter, distance matters. At 30 miles out, the lowest standard radar slice (0.5 degrees tilt) scans the atmosphere over Fleming Island at roughly 1,200 to 1,800 feet above ground level. This provides exceptionally good low-level coverage, enabling meteorologists and local residents to detect developing rotation, downdrafts, and low-level boundary collisions before they produce ground-level hazards.
In addition to KJAX, regional meteorologists occasionally reference secondary sources during maintenance or when severe storms cause signal attenuation:
- KVAX (Moody Air Force Base, Valdosta, GA): Useful for cross-referencing incoming squall lines from the northwest.
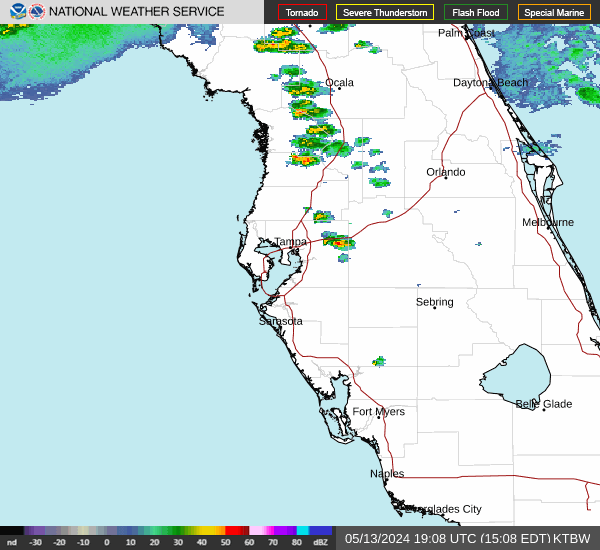
- KTBW (Tampa Bay): Helpful for analyzing deep convective bands traversing eastward across the Florida peninsula during winter and spring cold front passages.
- FAA Terminal Doppler Weather Radar (TDWR - TJAX): Positioned closer to Jacksonville's commercial flight paths, providing high-resolution low-altitude wind shear scans.
How Fleming Island's Geography Shapes Radar Displays
Fleming Island’s unique terrain—surrounded on three sides by water bodies—creates localized atmospheric signatures that frequently show up on radar screens throughout the spring and summer.
The Sea Breeze Convergence Zone
From late May through September, afternoon storms over Clay County are driven primarily by the interaction of two separate sea-breeze fronts:
- The Atlantic Sea Breeze: Pushes inland from the beaches of Duval and St. Johns counties, moving west across the St. Johns River.
- The Gulf Coast Sea Breeze: Travels inland from the west-southwest across central and northern Florida.
On composite radar loops, these boundaries appear as thin, fine green or blue lines (known as "fine lines" or boundary lines) reflecting bugs, dust, and temperature discontinuities. When the Atlantic boundary stalls near US-17 or collides with the Gulf boundary directly over Clay County, rapid thunderstorm initiation occurs. A clear sky over Fleming Island can transition into an intense, lightning-dense storm cell in under 20 minutes.
The River Effect on Local Precipitation
The St. Johns River is nearly two to three miles wide adjacent to Fleming Island. During early summer, when the river water remains relatively cool compared to the sun-baked asphalt of suburban subdivisions, a faint "river breeze" can set up. This cooler air dome can occasionally split incoming cells or, conversely, create a localized boundary along the riverbank that focuses heavy rain directly over neighborhoods such as Eagle Harbor, Pace Island, and Fleming Island Plantation.
Interpreting Weather Radar in Fleming Island: Key Products
Modern interactive radar applications offer far more than simple green-to-red rain maps. To assess threats accurately, residents should understand three core radar products:
1. Base Reflectivity vs. Composite Reflectivity
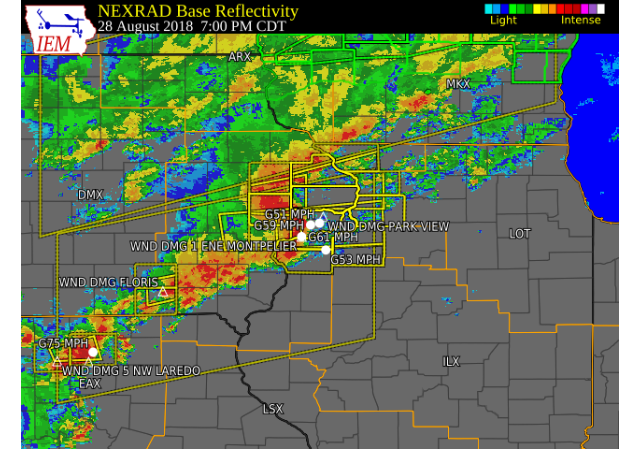
Base Reflectivity shows precipitation intensity at the lowest scanned elevation angle. It is the best metric for determining what is actually falling near the ground right now. Values are measured in decibels of Z (dBZ):
- 20–30 dBZ: Light rain or mist.
- 35–45 dBZ: Moderate to heavy rain typical of steady showers.
- 50–55 dBZ: Intense downpours with significant lightning and potential minor street flooding.
- 60+ dBZ: Severe storms, often indicating hail or torrential rainfall capable of producing flash flooding on local roadways like County Road 220.
Composite Reflectivity, on the other hand, displays the maximum echo intensity across all vertical tilt levels. If composite reflectivity shows bright purple (65 dBZ) while base reflectivity shows moderate green (30 dBZ), a severe storm is likely suspended aloft and may produce a sudden downburst or microburst when it collapses.
2. Base Velocity (Storm Relative Velocity)
Velocity products measure whether wind-driven rain is moving toward the radar (conventionally shaded green) or away from the radar (shaded red). When bright green and bright red pixels appear tightly coupled side-by-side over Clay County, it indicates rotation. For Fleming Island residents, monitoring velocity maps during Severe Thunderstorm or Tornado Warnings is critical for determining whether rotation is tracking near residential corridors or out over open water.
3. Correlation Coefficient (CC) and the Debris Ball
Correlation Coefficient compares the shape and size of targets in the air. Uniform targets like raindrops produce high CC values (near 1.0). When a tornado touches down and lofts non-meteorological debris—such as insulation, branches, or roof shingles—the CC values plummet sharply (below 0.8) within a tight area of rotation. A coincident drop in CC alongside a velocity couplet confirms that debris is airborne, providing definitive evidence of a tornado.
Seasonal Radar Patterns to Watch in Fleming Island
Storm tracking in Clay County changes significantly depending on the time of year:
Summer Pulse Storms and Microbursts (June – September)
Summer storms are typically non-frontal, slow-moving "pulse" thunderstorms. Radar monitoring during summer should focus on cell drift speed. Slow-moving cells dumping 2 to 3 inches of rain per hour frequently overwhelm drainage basins along low-lying sections of Doctors Inlet and Black Creek. Watch for rapid vertical growth on composite loops, followed by quick downward expansion of heavy cores—a signature of wet microbursts producing straight-line winds up to 60 mph.
Tropical Systems and Spiral Rainbands (August – November)
When tropical storms or hurricanes track across Florida or parallel the Atlantic coastline, radar screens display sweeping spiral bands. In tropical setups, low-level wind shear is extreme. Tornadoes within outer tropical rainbands often form rapidly without typical severe hail cores; they appear as shallow, fast-moving "mini-supercells" that require vigilant velocity tracking.
Winter and Spring Pre-Frontal Squall Lines (December – April)
Cold fronts pushing across the southeastern United States frequently push organized lines of storms (QCLSs, or quasi-linear convective systems) across northern Florida. These show up as sharp, distinct lines on radar advancing quickly from the west or northwest. Bow echoes—segments of the line that bulge forward in the direction of motion—are common indicators of damaging straight-line winds heading toward Fleming Island.
Practical Tips for Boaters and River Recreation
Because Fleming Island is surrounded by boating hubs along the St. Johns River and Black Creek, relying on an hourly forecast alone is dangerous. Before heading onto the water, follow these radar best practices:
- Check radar motion history: Look at the 60-minute loop, not just a static snapshot. Note cell propagation speed and whether storms are building back-to-front (training).
- Monitor upstream cells in Baker and Bradford Counties: Storms originating west of Clay County often ride westerly steering winds directly toward the St. Johns River during late afternoon.
- Account for radar latency: Free consumer weather apps often cache radar images by 5 to 15 minutes. In a fast-moving squall, a storm can move 10 miles in 15 minutes. Always ensure your radar viewer uses live NWS level-II or level-III data feeds.
- Set geofenced polygon alerts: Rely on National Weather Service polygon warnings rather than countywide alerts, as Clay County extends far south and west into rural areas that may experience severe weather while Fleming Island stays completely dry.
Staying Informed and Prepared
Accurate radar interpretation bridges the gap between passive weather awareness and decisive action. Whether you are navigating Doctors Lake, driving along Highway 17 during peak rush hour, or securing your patio furniture ahead of an approaching line of storms, tracking Fleming Island weather radar provides the situational clarity needed to stay safe across all seasons in northeast Florida.