What Are the Most Violent Cities in America? The Data
When people research what are the most violent cities in america, they often expect a clear-cut, ranked list. However, criminologists and federal agencies emphasize that assessing which communities are the most violent or harmful is largely subjective and depends on diverse perspectives, statistical thresholds, and the specific metrics used. Simplified rankings frequently obscure the complex social, economic, and geographic realities of urban crime.

To evaluate violent crime accurately, one must examine reliable public data sources, understand how offenses are categorized, and recognize how neighborhood-level dynamics differ from city-wide statistics.
How Violent Crime Is Measured in the United States
The primary source for nationwide crime data is the Federal Bureau of Investigation (FBI) through its Uniform Crime Reporting (UCR) program and the National Incident-Based Reporting System (NIBRS). The FBI classifies violent crime into four distinct offenses:
- Homicide: Murder and non-negligent manslaughter.
- Rape: Penetration, no matter how slight, of the vagina or anus with any body part or object, or oral penetration by a sex organ of another person, without consent.
- Robbery: Taking or attempting to take anything of value from the care, custody, or control of a person by force, threat of force, or violence.
- Aggravated Assault: An unlawful attack by one person upon another for the purpose of inflicting severe or aggravated bodily injury.
To allow comparisons between cities of different sizes, crime analysts calculate a violent crime rate per 100,000 residents. A city of 100,000 residents with 1,000 violent crimes has the same statistical rate as a city of 1,000,000 residents with 10,000 violent crimes, even though the raw volume of incidents is ten times greater in the larger metropolis.
Analyzing the Data: What Are the Most Violent Cities in America?
Rather than providing an authoritative ranking—a practice the FBI explicitly warns against because it leads to simplistic and misleading evaluations—researchers point to cities that consistently report elevated violent crime rates across standardized per-capita metrics. Assessments often vary depending on whether researchers set a population minimum (such as 100,000 residents) or evaluate all incorporated municipalities.
Major Metros with High Per-Capita Rates
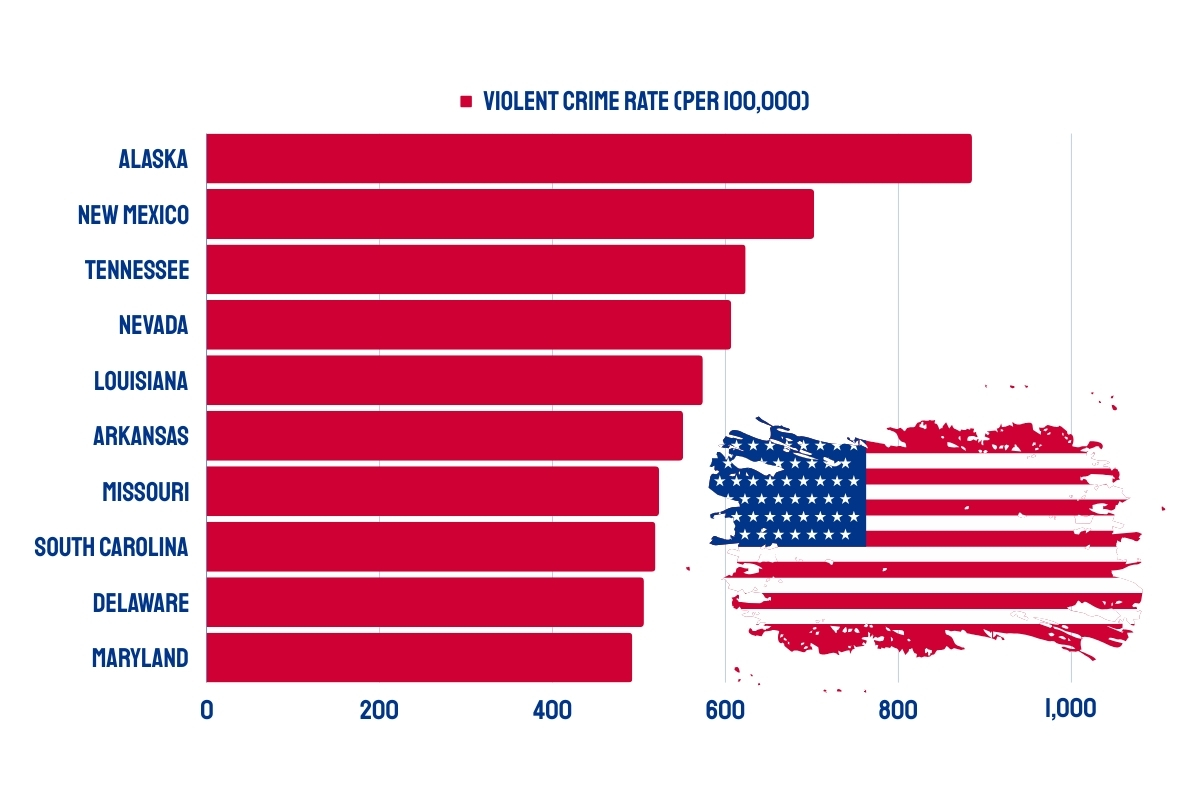
Among mid-sized and large American cities (populations exceeding 100,000), several municipalities routinely report violent crime rates well above the national average of approximately 380 violent crimes per 100,000 residents:
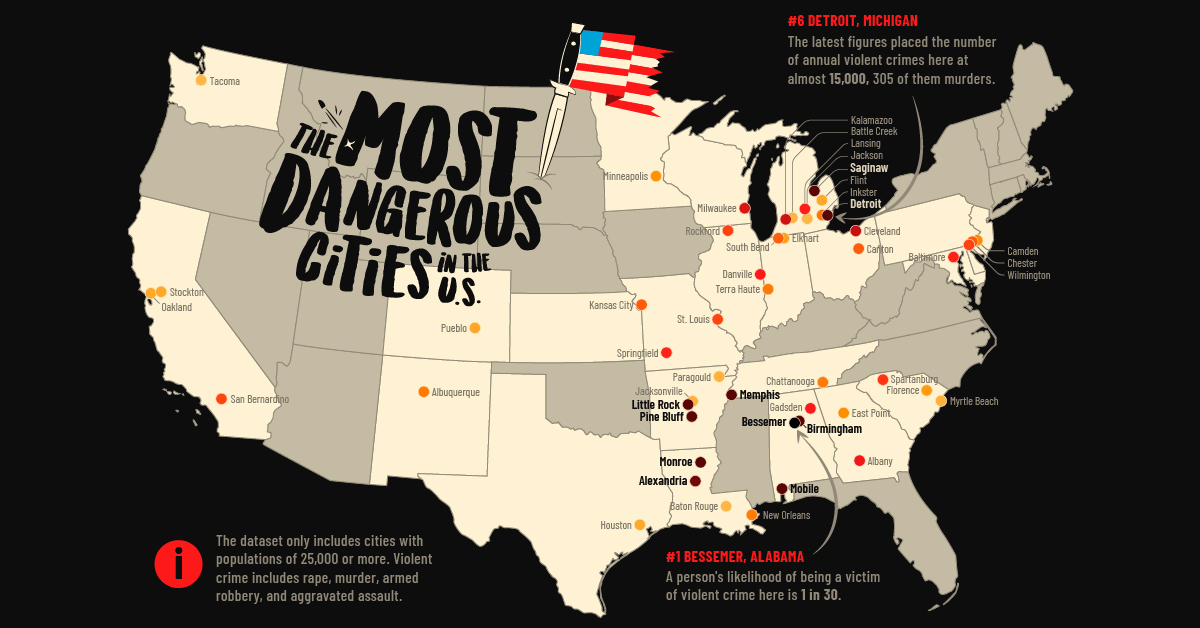
- Detroit, Michigan: Detroit has long recorded high rates of aggravated assault and homicide, frequently reporting violent crime rates exceeding 1,500 to 2,000 per 100,000 residents in recent years, though homicides dropped to historic multi-decade lows in 2023.
- Memphis, Tennessee: Memphis experienced sharp increases in both homicides and non-fatal shootings over the early 2020s, resulting in one of the highest per-capita rates of violent crime among cities with more than 500,000 residents.
- Baltimore, Maryland: Known historically for elevated homicide numbers, Baltimore has recorded violent crime rates substantially higher than the national median, driven primarily by localized gun violence and aggravated assaults.
- St. Louis, Missouri: St. Louis frequently appears in statistical analyses with high violent crime rates, an outcome partly amplified by its strict jurisdictional boundary (the independent city of St. Louis does not include its surrounding, lower-crime suburbs in its municipal statistics).
- Little Rock, Arkansas: Often overlooked in national media, Little Rock regularly reports high rates of aggravated assaults and robberies relative to its population of roughly 200,000.
- Cleveland, Ohio: Experiencing post-industrial economic challenges, Cleveland reports persistent violent crime rates above 1,500 per 100,000 residents, particularly concentrated in areas with high structural poverty.
The Role of Smaller Jurisdictions
If small towns and minor cities (under 50,000 residents) are included in the dataset, the statistical picture shifts dramatically. Jurisdictions such as Bessemer, Alabama, or Monroe, Louisiana, frequently post per-capita violent crime rates higher than those of major metropolitan areas. In smaller populations, a modest number of incidents can cause the per-capita rate to surge, illustrating why comparing communities of vastly different scales requires caution.
Video: The 10 DEADLIEST Cities in the US You Need to Avoid in 2025

The Hyper-Local Nature of Violent Crime
One of the most critical findings in modern criminology is that violent crime is not evenly distributed across an entire city. Criminologist David Weisburd's "law of crime concentration" demonstrates that in almost every city, the majority of violent incidents occur within a tiny percentage of street segments and micro-neighborhoods.
Labeling an entire city as uniformly "violent" ignores the reality that large portions of these cities experience crime rates comparable to quiet suburban communities. Factors that drive concentrated violence include:
- Economic Disinvestment: Persistent, generational poverty and high unemployment rates correlate strongly with rates of interpersonal violence.
- Housing Instability: Neighborhoods with high vacancy rates, abandoned properties, and lack of municipal infrastructure often face elevated rates of illicit activity.
- Social Networks and Conflict: A substantial proportion of urban homicides and non-fatal shootings involve small, identifiable networks of individuals engaged in recurring retaliatory disputes.
Recent National Trends: Is Violence Increasing or Decreasing?
Public perceptions of crime often diverge from measurable reality. Following a sharp, nationwide surge in homicides during 2020 and 2021—coinciding with the societal disruptions of the COVID-19 pandemic—data from the FBI and independent research groups like the Council on Criminal Justice (CCJ) and AH Datalytics showed a significant turnaround.
Through 2023 and 2024, the United States recorded some of the largest single-year declines in violent crime and homicide in modern history. Major cities that faced record-high rates in 2020 and 2021 reported double-digit percentage drops in homicides and non-fatal shootings. While rates remain elevated relative to the historic lows of the mid-2010s in certain pockets, the national trajectory shows broad-based decreases across diverse urban centers.
Why Experts Advise Against City Rankings
The FBI explicitly publishes a disclaimer warning against ranking communities based on its UCR and NIBRS data. The bureau notes that crime rates are influenced by dozens of variables outside the control of law enforcement and local government, such as:
- Population density and the size of the commuting workforce.
- Economic health and job market availability.
- Varying reporting practices among individual police departments (some agencies underreport or experience delays in transitioning to newer federal standards).
- Differences in state and municipal penal codes regarding how specific offenses are charged.
Because these conditions differ widely, designating specific places as the "most dangerous" provides an incomplete evaluation of community health and public safety.
Conclusion
Understanding violent crime requires moving past superficial top-ten lists and examining localized data, structural conditions, and shifting multi-year trends. While cities like Detroit, Memphis, and Baltimore continue to navigate elevated per-capita violent crime, violence within those cities remains heavily concentrated in specific neighborhoods, with significant progress recorded nationwide over recent reporting cycles.