What Happens When You Flip a Coin 10 000 Times?
Human intuition about probability is notoriously flawed. When most people think about tossing a coin, they expect an immediate, rigid alternation between heads and tails. If you decide to flip a coin 10 000 times, however, you quickly enter a fascinating realm of mathematics where chaos gives way to predictable statistical laws.

Whether performed by hand, mechanical rigs, or computer simulations, massive coin-tossing experiments reveal deep truths about probability theory. Here is a breakdown of what actually happens when you commit to ten thousand flips.
The Law of Large Numbers in Action
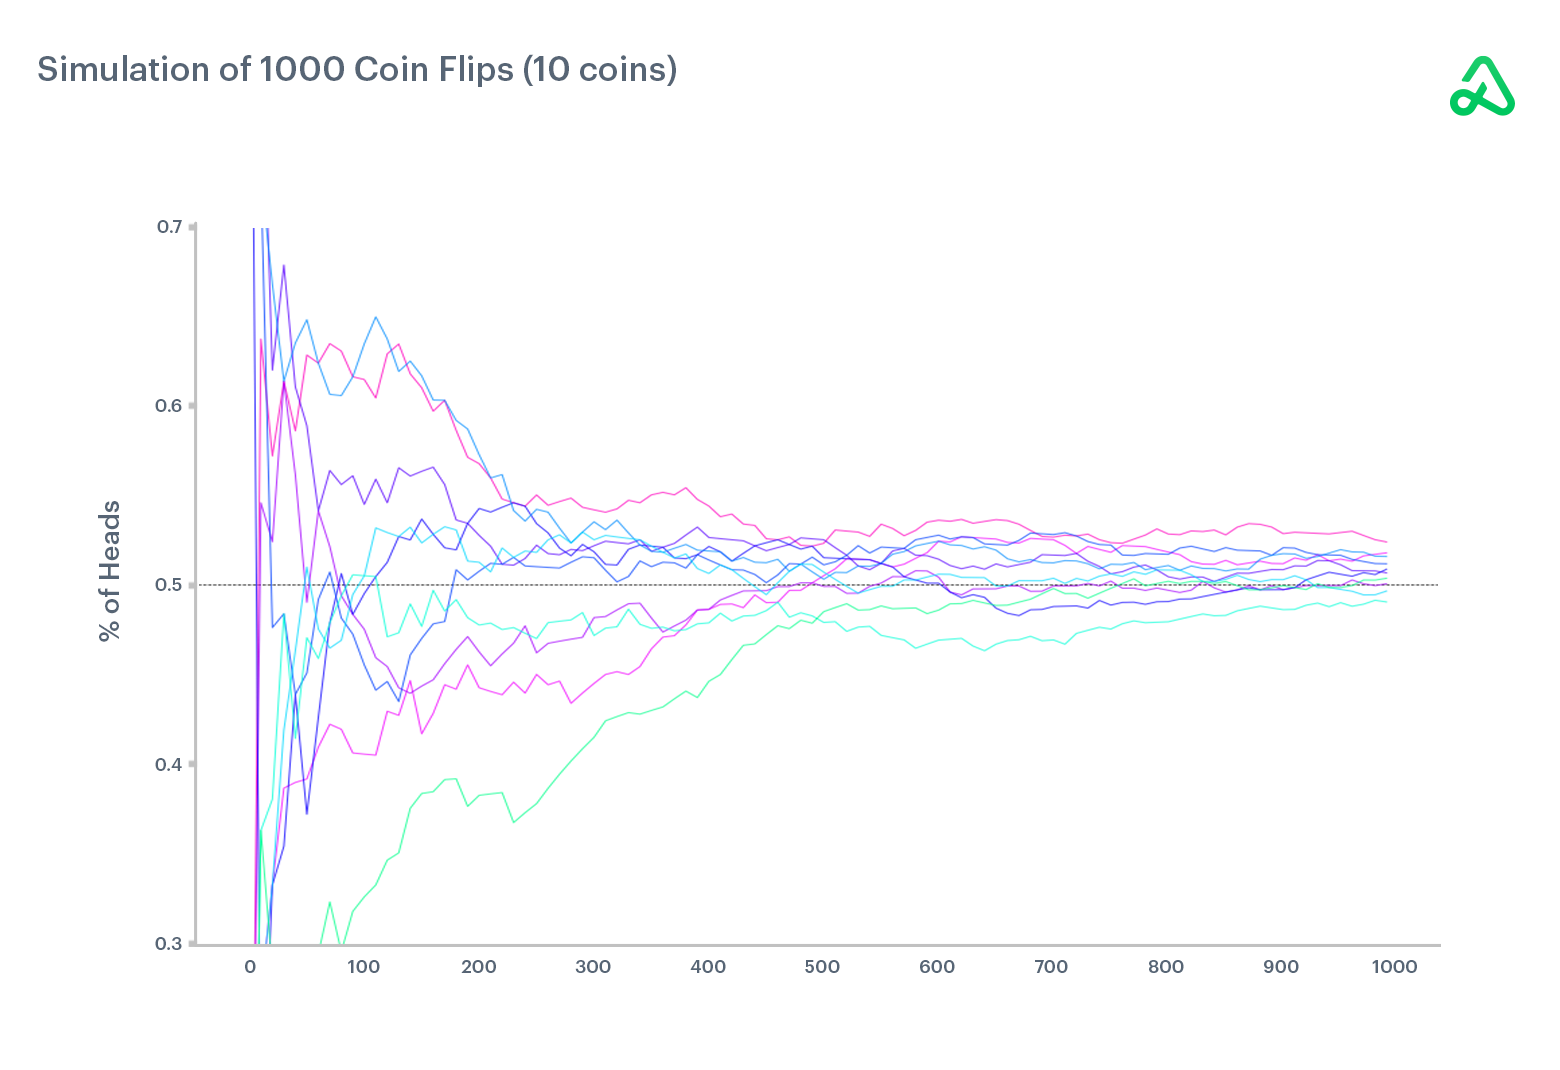
The single most important concept governing a long sequence of coin tosses is the Law of Large Numbers. In probability theory, this theorem states that as the number of identically distributed, random trials increases, the relative frequency of an outcome will converge on the theoretical probability.
For a fair coin, the theoretical probability of getting heads is exactly 50% (0.5), and tails is 50%. If you only flip the coin 10 times, random variance can easily skew your results. You might get 8 heads and 2 tails (an 80% split), and you wouldn't think much of it.
However, as you scale that up toward 10 000 flips, that kind of wild deviation becomes mathematically improbable. The percentage of heads and tails will inevitably hug closer and closer to that 50/50 center.
What the Numbers Actually Look Like
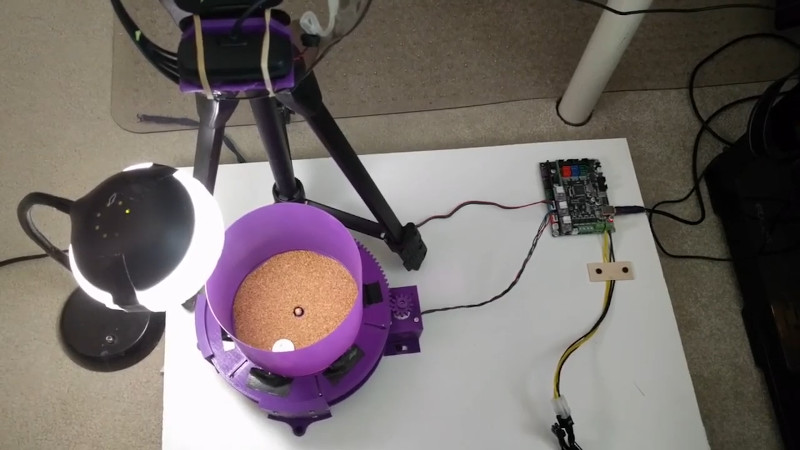
If you program a computer to run a simulation or build a mechanical coin-flipper to execute 10 000 trials, what kind of final tally can you expect to see?
Video: We Flipped A Coin 10,000 Times!

- The Final Count: You will rarely land on an exact 5,000 to 5,000 split. Instead, a typical fair coin simulation usually yields somewhere between 4,900 and 5,100 heads, with the remainder being tails.
- The Absolute Difference: While the percentage difference is microscopic, the absolute difference (e.g., 5,015 heads versus 4,985 tails) might be around 30 flips. This raw numerical gap often surprises people who expect the totals to match down to the exact digit.
- The Longest Streaks: Human brains hate streaks because we perceive them as "non-random." In reality, true randomness produces surprisingly long runs. In 10 000 flips, you are almost guaranteed to see a streak of at least 12 to 14 consecutive heads or tails.
The Gambler’s Fallacy
One of the greatest psychological takeaways from tracking thousands of coin flips is overcoming the Gambler’s Fallacy. This is the erroneous belief that if something happens more frequently than normal during a given period, it will happen less frequently in the future.
If you flip a coin 10 000 times and notice that heads has come up five times in a row, the coin does not have a memory. It does not "owe" you a tails. The probability of getting heads on the sixth flip remains stubbornly, exactly 50%. Observing a massive dataset helps demystify this cognitive bias, proving that short-term patterns have no bearing on future independent trials.
Real-World Physics vs. Ideal Math
It is worth noting that real-world coins are rarely mathematically perfect. When researchers at Stanford University studied coin tossing using a high-speed camera and mechanical flippers, they discovered a subtle physical bias.
A coin that starts with heads facing upward tends to land on heads slightly more often—roughly 51% of the time—due to slight asymmetries in weight distribution and the physics of the wobble as it settles. Therefore, if you manually flip a standard quarter 10 000 times, you might find that the results lean slightly toward the starting side. True 50/50 probability assumes an idealized coin that can bounce infinitely and has zero thickness.
Conclusion
Deciding to flip a coin 10 000 times bridges the gap between abstract mathematical theory and tangible reality. While short-term results are governed by unpredictability and wild streaks, the macro view demonstrates the unshakable stability of the Law of Large Numbers. Whether you run the test via computer code or physical endurance, the experiment remains one of the best ways to visualize probability in action.